
The hottest nights on Earth are warming faster than the hottest days. Ruth Emerton and colleagues at the UK Met Office documented the asymmetry in their analysis of global extreme heat: the ten warmest nights gaining 0.32°C per decade, the ten warmest days 0.27°C. Five hundredths of a degree per decade of differential. The floor rising faster than the ceiling. The recovery window closing faster than the stress window widens.
That phrase, recovery window, does a lot of structural work, because it names something that has operated so reliably for so long that nobody thought to call it infrastructure. The night cools. It has always cooled. Human thermoregulation, fire behavior, electrical grids, concrete and asphalt and soil moisture: every one of these systems has depended on the hours between sunset and sunrise to dissipate enough of the previous day's accumulated heat that the next cycle can begin from a survivable baseline. The night was the reset for every heat-loaded system on the surface of the planet. Nobody built it, nobody maintained it, nobody wrote a budget line for it, and if you'd asked any engineer or physiologist or fire behavior analyst whether they were relying on it, they would have looked at you the way you'd look at someone asking whether you rely on gravity. It was that fundamental. And now it is degrading, measurably, faster than the daytime warming that dominates every climate headline you've read this year.
What thirty-nine nights look like
Phoenix is where the abstraction hits a thermometer. At Sky Harbor, the station with the longest continuous record in the metro area, 2024 posted the warmest average overnight low ever recorded: 66.7°F. 2025 came in second at 66.4°F. Two consecutive years holding the top two positions in a record that goes back decades.
How much of that trend is the planet warming and how much is the city itself is a genuine question, and it is not cleanly resolvable. Climate Central has reported that summer nights in Phoenix have warmed 6.5°F since 1970, attributing the change to both climate change and the urban heat island effect. The NWS notes that the Phoenix station record began downtown in 1896 and moved to Sky Harbor in the 1950s, which complicates any long-term trend analysis. And the heat island is not a confound you can subtract cleanly from the climate signal. It is a consequence of building a city that stores daytime heat in miles of dark asphalt and radiates it back through the hours when the air was supposed to cool. The two forces compound. Researchers disagree about the ratio. Nobody disputes the direction.
The annual average, though, compresses the nights that actually kill people. Phoenix historically averages about seven nights per year that never drop below 90°F. In 2024, there were thirty-nine. Thirty-nine nights where the outdoor air never offered a body or a building or a grid anything resembling a reset. If you've spent time in the field doing any kind of environmental monitoring, you know what it means when a measurement that used to be an outlier starts showing up as a cluster. It means the system that was producing the old baseline has shifted. The question is no longer whether the anomaly is real. The question is what the new baseline is.
The thermostat at 2 a.m.
In Maricopa County, the Senior and Adult Services Division provides case management to roughly 6,000 people each year who are sixty or older or living with a disability. During National Weather Service heat warnings, the division places weekly courtesy calls to its most vulnerable clients. In 2023, ninety-three people were on that list. Staff were trained not to ask whether the home "feels hot," because an older adult in heat distress may not perceive the danger accurately. The question instead:
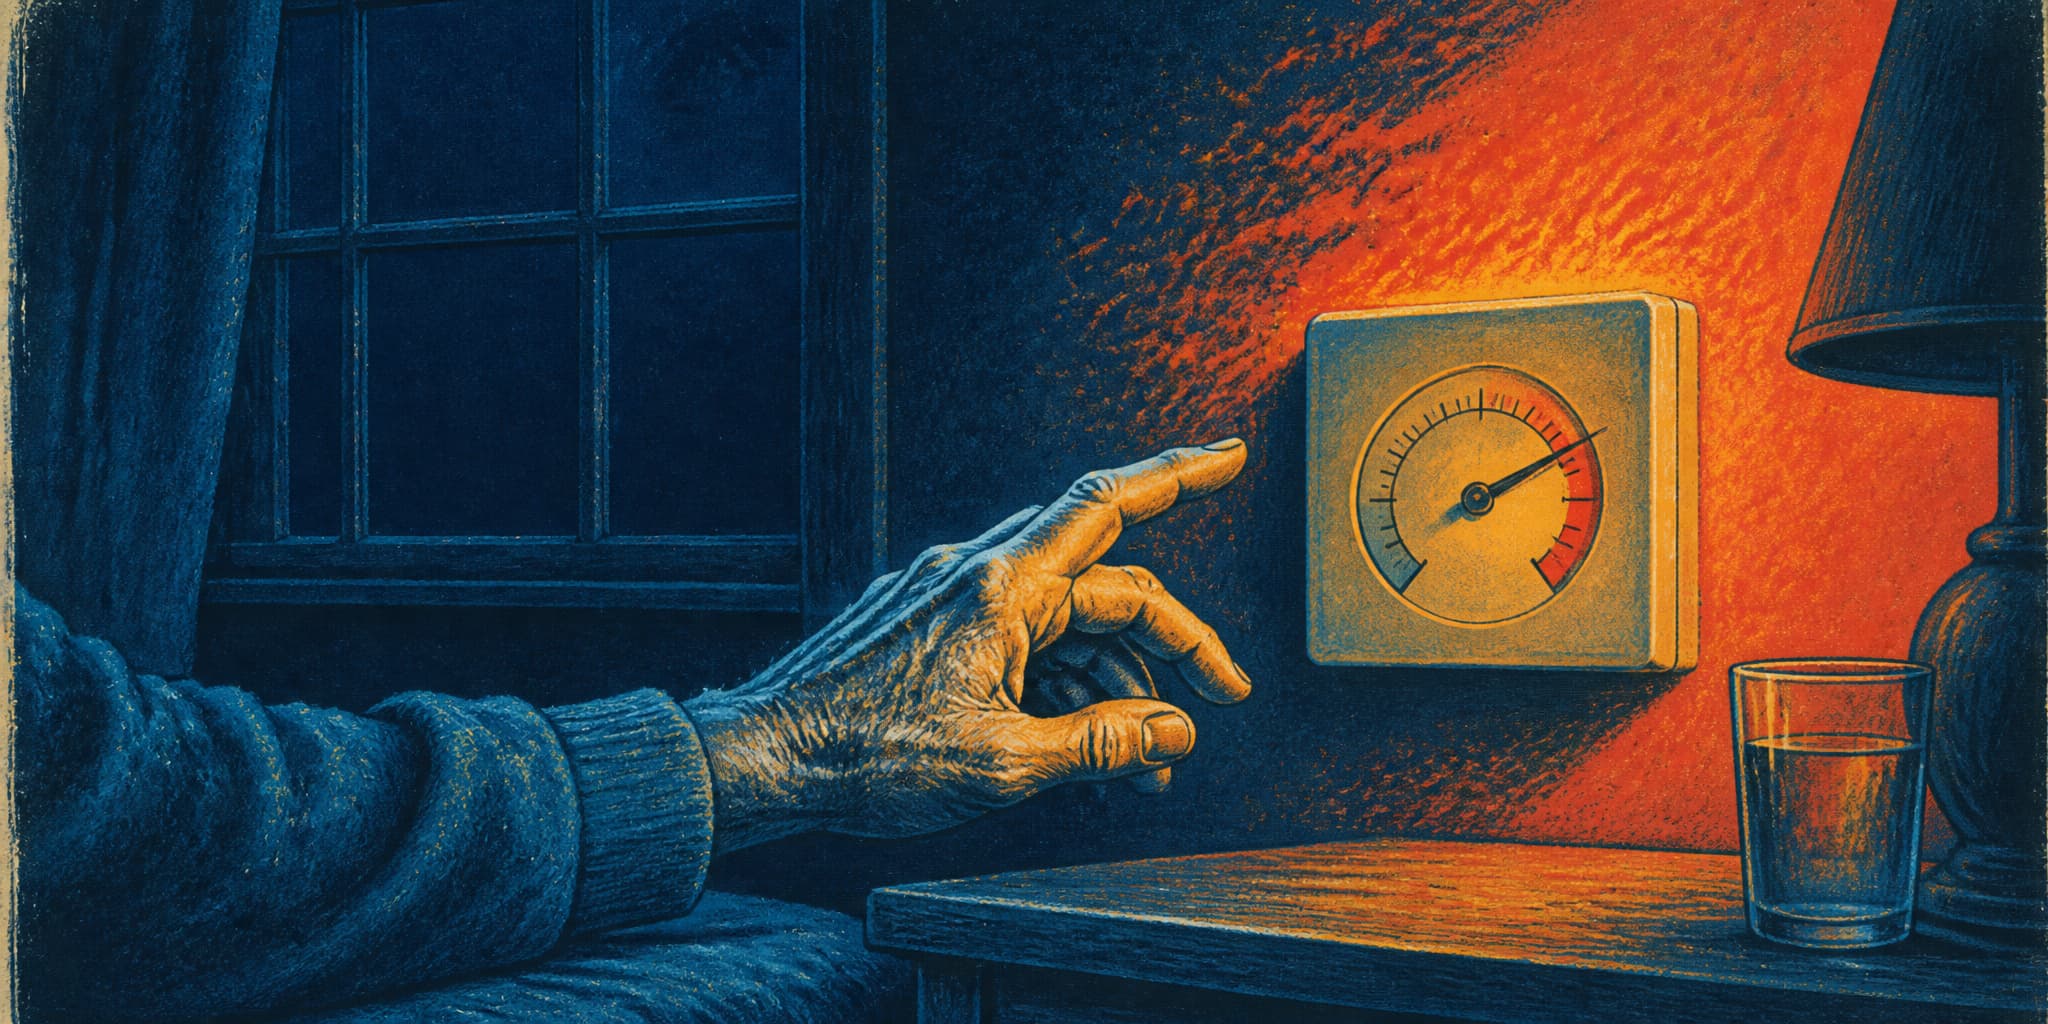
"What temperature does your thermostat say right now?"
That question is a small piece of institutional design that reveals the entire problem. The body's own sensing apparatus becomes unreliable under exactly the conditions when accurate sensing matters most. So you route around the body. You ask the instrument. Anyone who has ever calibrated a sensor against a known standard recognizes the logic: when your primary measurement is suspect, you go to the reference.
Home-health aides and attendant-care workers in Phoenix check hydration, verify that the AC is running, note medications that impair thermoregulation. Arizona's electronic visit verification system timestamps each visit's start and end, the worker, the service type. The record creates a trail of someone entering a home at a specific hour and finding what they find. When what they find is a bedroom at 28°C (about 82°F) at two in the morning, the protocol is clear: contact the case manager, arrange a portable cooling unit, call 911 if the person shows signs of heat illness. The protocol works. But it was designed with an assumption baked so deep nobody stated it. The night itself would do part of the job. The aide was supposed to be a check on an already-cooling system, not the only thing standing between a person and a room that never stopped being hot.
At 28°C, the person in that bed is already losing ground. A 2025 study in BMC Medicine monitored forty-seven adults aged sixty-five and older across more than fourteen thousand valid nighttime sleep hours. At bedroom temperatures between 28°C and 32°C, the odds of clinically relevant heart-rate variability reduction nearly tripled compared with temperatures below 24°C. Even the 24°C-to-26°C range produced 1.4 times greater odds. The autonomic nervous system failing to shift into recovery mode. The body staying in sympathetic dominance. Heart rate elevated, blood pressure regulation impaired, through the hours it was supposed to be repairing itself.
A 2024 randomized trial in Environmental Health Perspectives confirmed the pattern from a different angle: older adults exposed to 31°C for eight hours showed core body temperature elevated by 0.7°C and impaired cardiovascular responses to standing. A 2023 study in Science of the Total Environment found sleep efficiency dropped five to ten percent when bedroom temperature climbed from 25°C to 30°C.
There is no single threshold at which the body fails overnight, and the guidance reflects genuine disagreement about where to draw lines. The WHO recommends nighttime room temperatures below 24°C during heat waves for vulnerable populations. Health Canada's June 2026 guidance sets 26°C as the upper indoor limit for adults over sixty and flags 31°C as the point where health impacts escalate dramatically. The two-degree gap between those recommendations reflects different evidence reviews, different risk tolerances, and a field still working out how to translate graded physiological risk into actionable numbers. What the research collectively describes is a slope, not a cliff. Each degree the overnight temperature stays elevated, the body recovers a little less. Each night that recovery is incomplete, the next day's heat load begins from a higher baseline. Over consecutive hot nights, the deficit accumulates. The WHO's 2026 heat-and-health fact sheet states it plainly: extended periods of high daytime and nighttime temperatures create cumulative physiological stress.
The night is where the cumulation either resets or compounds. The aide reading the thermostat at 2 a.m. knows which one is happening. The client, whose own heat perception may already be compromised, may not.
The fire that doesn't lay down
The same overnight recovery window that cools human bodies has historically cooled landscapes. As relative humidity climbed after sunset and temperatures dropped, fire behavior slowed. Flames laid down. Crews used the overnight hours to cut line, establish containment, reposition. The pattern was so reliable it structured the entire operational logic of wildland firefighting. The night was when you gained ground, because the fire rested.
Except the fire never rested. The weather rested, and the fire responded. Now the weather is resting less.
Luo et al., published in Science Advances in April 2026, documented what happens when the weather stops resting. Analyzing 8,993 North American fires larger than 200 hectares from 2017 to 2023 using hourly satellite detections, they found roughly one-third of active fire days in subtropical and temperate mountain biomes sustained at least twelve continuous burning hours. Twelve percent of active days in subtropical mountains burned through a full twenty-four-hour cycle. Fourteen percent of active days with nighttime burning actually peaked in fire intensity at night.
The mechanism is the same one operating on bodies and grids: the overnight weather cycle that historically constrained fire activity is weakening. Luo et al. identify reduced humidity recovery and asymmetric diurnal warming as the primary drivers. The night warms. The humidity doesn't recover. The landscape stays primed.
The longer trend lines are striking:
| Metric (western temperate mountains, 1975–2024) | Change |
|---|---|
| Modeled potential burning hours | +22% |
| Days with ≥12 potential burning hours | +86% |
| Days with 24 potential burning hours | +225% |
The paper is careful to note these are weather-conditioned estimates that don't encode changes in fuels, ignition patterns, or suppression strategy. The weather constraint itself is what's loosening. A fire doesn't know it's supposed to stop at sunset. It responds to humidity and temperature. The lull was never a property of fire. It was a property of the night, and the night is losing it.
The grid that can't exhale
Electrical grids have their own version of overnight recovery. Demand drops after midnight. Transformers cool. Utilities perform maintenance on lines and substations that can't be taken offline during peak hours. The overnight valley in the load curve is the interval during which the system that delivers cooling to millions of homes repairs and prepares itself to deliver cooling again tomorrow. The grid's version of sleep.
In Phoenix, that valley is filling in. APS reported that during 2024's 113-day stretch above 100°F, high nighttime temperatures kept air conditioners running around the clock. The utility set a peak demand record of 8,210 MW on August 4, 2024. In 2025, the record broke again: 8,631 MW. The Arizona Corporation Commission noted that both APS and SRP set new peak records for the third consecutive year in 2025.
Neither utility publishes an overnight minimum demand series in its public reporting, so calculating exactly how much the trough has flattened requires data that isn't available at this resolution. What is available is the utility's own language: APS explicitly connected record demand to high nighttime temperatures and around-the-clock air conditioning load. When a utility tells you the AC never turns off, it is telling you the overnight valley is filling in.
The dependency running through all of this becomes visible at the grid level. A person in a Phoenix home at 2 a.m. needs the air conditioner to compensate for a night that no longer cools. The air conditioner needs the grid. The grid needs the overnight demand valley to cool its transformers, maintain its lines, and rebuild its margins for tomorrow's peak. The overnight demand valley depends on the night being cool enough that not everyone runs their AC through every hour of darkness.
The system that compensates for the night's failure depends on the night to function. You need the thing that's breaking in order to run the thing that replaces it.
Each year the overnight low rises, the loop tightens. The body needs more mechanical cooling. The grid carries more overnight load. The grid's recovery margin shrinks. The probability of the grid failing during the hours when the body most needs it goes up. Not dramatically. Not all at once. The way an aquifer drops: measurably if you're watching the monitoring well, invisibly if you're drawing from the tap. My father could have drawn you this curve on a napkin. Different resource, same shape. A decline that looks like stability until the year it doesn't.
What nobody budgeted for
The night performs its cooling function on everything. Concrete. Soil. Water bodies. Vegetation. Livestock. Rail infrastructure, which buckles when it can't contract overnight. Asphalt, which softens. The human body is one system among many that evolved or was engineered around the assumption of a nightly thermal reset. The research from multiple domains is converging on the same finding: the reset is weakening, and the weakening is accelerating faster than the daytime warming that gets the headlines.
Emerton et al.'s asymmetry is a structural finding about which part of the climate system is degrading fastest. It happens to be the part we never recognized as infrastructure because it never sent an invoice.
So the question is genuine, and it is yours. Where in your own life do you depend on overnight recovery you haven't examined? The assumption that you'll sleep cooler than you worked. That your evening run is safe because the temperature dropped. That your home will radiate enough heat overnight that tomorrow's AC load starts from a manageable baseline. That the grid will be there at 3 a.m. because demand always drops at 3 a.m.
These assumptions are encoded in exercise habits, travel plans, building designs, utility rate structures, fire suppression strategies, and the shift schedules of every person whose job is to check on someone vulnerable in the middle of the night. All of them depend on the night doing something it has always done.
The night is still doing it. Just less. Each year, measurably less. The floor is rising. And the people who encounter its failure first are not reading about temperature asymmetries in climate journals. They are the ones reading a thermostat at 2 a.m. in a room that should have cooled by now, understanding the number, carrying that knowledge back out into a night that was supposed to keep it lower.
- Heat below the threshold: A 2026 Nature Communications paper found that deadly heat-stress conditions have already occurred below the familiar 35°C wet-bulb shorthand, especially for older adults and people in direct sun.
- Smoke that doesn't clear: A 2026 Science study reported that U.S. progress toward ozone air quality standards reversed after 2015, driven primarily by increasing wildfire emissions that persist through overnight hours when ozone was expected to dissipate.
- Indoor deaths and cooling gaps: Maricopa County's 2025 heat report found AC was present in 94% of indoor heat-death cases, but among those, the unit was not functioning in 72% of cases, a distinction that separates the presence of cooling from the verb.
- Cumulative heat and illness forecasting: A 2026 GeoHealth paper modeled heat-related illness across the fifty-three largest U.S. metro areas through 2040, linking risk to extreme-heat profiles, demographics, health status, and household cooling behavior.