
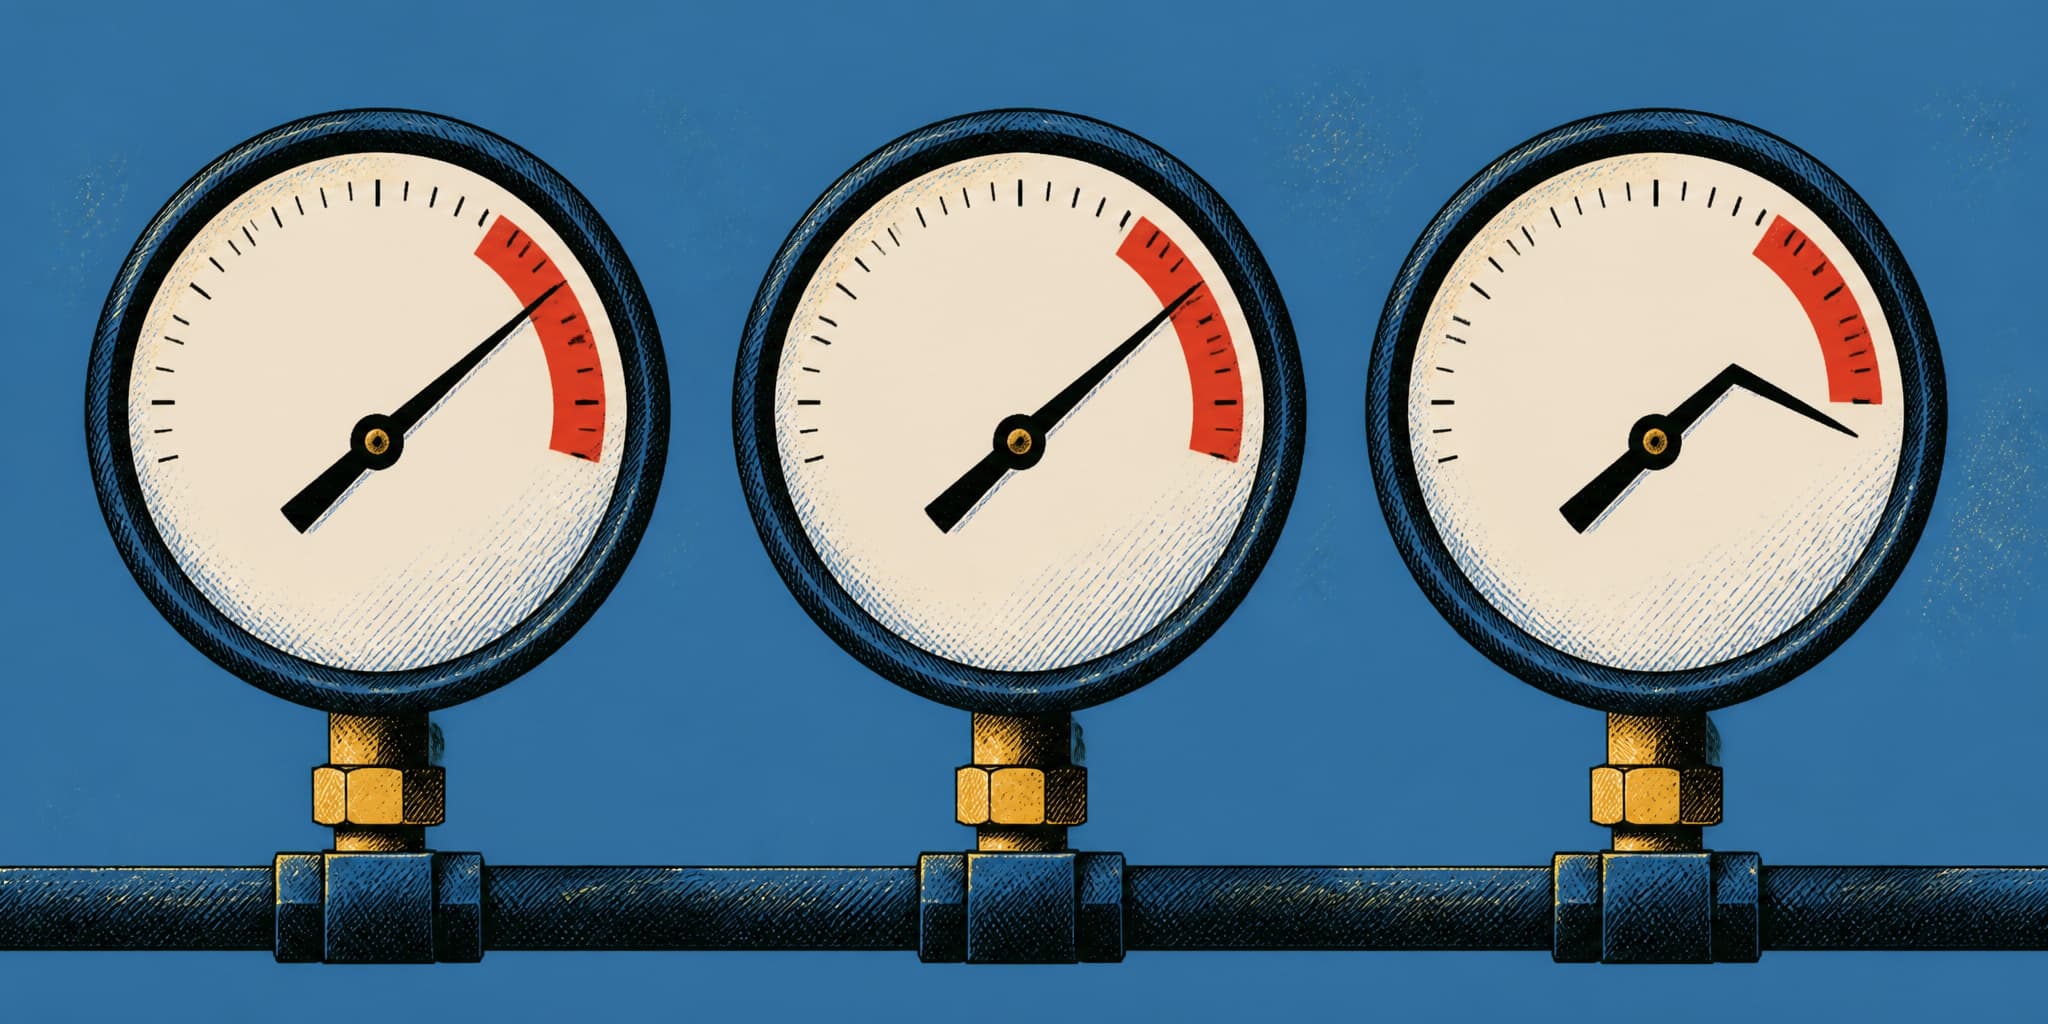
LGES swung to KRW 113.3B operating profit. Samsung SDI posted its first profitable quarter since Q2 2024. SK On reported KRW 821.8B operating profit against a Q1 loss of KRW 349.2B. Three improved quarters inside five weeks invite the market-turn read, and the disclosures don't support it. LGES's improvement is manufacturing economics that failed to convert to cash. Samsung SDI's includes consolidated AMPC and a tariff refund, neither allocated to the battery segment. SK On's includes customer compensation the company named and declined to size. Convergent improvement from divergent causes is not a market signal.
This piece builds on the individual Q2 decompositions published in Issues #10 (LGES), #11 (SK On), and #12 (Samsung SDI). It adds the cross-maker comparison and a cash-conversion layer the individual pieces could not provide.
USD equivalents use the Federal Reserve's Q2 2026 average of KRW 1,500.48/USD, applied to revenue and operating profit rows only. The prior Samsung SDI and SK On pieces used approximate rates of KRW 1,370 and KRW 1,380; the figures here supersede those conversions.
LGES — trailing four quarters
LGES is a standalone battery company. Revenue uses the restated 2026 basis, which includes NA production incentives in revenue across all quarters for comparability.
| KRW billion | Q3 2025 | Q4 2025 | Q1 2026 | Q2 2026 |
|---|---|---|---|---|
| Revenue | 6,065 | 6,474 | 6,555 | 7,560 ($5.04B) |
| Operating profit/(loss) | 601.3 | (122.0) | (207.8) | 113.3 ($75.5M) |
| NA production incentives | 365.5 | 332.8 | 189.8 | 241.0 |
| Ex-incentive result | 235.8 | (454.8) | (397.6) | (127.7) |
| Operating cash flow | 1,267 | 1,753 | (316) | 25 |
| Utilization | — | — | — | 52.8% ¹ |
| ASP direction | — | — | — | — |
| EV/ESS mix | — | — | ~mid-20% ESS ² | — ³ |
¹ H1 2026 figure, not Q2-specific. Value-based measure across facilities; does not isolate ESS or EV line performance (Issue #12 sidebar). ² Management commentary from Q1 call (Korean-language transcript). ³ Q2-specific mix not disclosed; H1 ESS described as "high-20% range" of total revenue.
Samsung SDI — trailing four quarters
Samsung SDI reports a battery segment within a consolidated entity that includes electronic materials. AMPC is disclosed only at the consolidated level; battery-segment ex-AMPC cannot be calculated.
| KRW billion | Q3 2025 | Q4 2025 | Q1 2026 | Q2 2026 |
|---|---|---|---|---|
| Consolidated revenue | 3,052 | 3,859 | 3,576 | 3,769 ($2.51B) |
| Battery-segment revenue | 2,820 | 3,622 | 3,354 | 3,519 ($2.35B) |
| Consolidated operating profit/(loss) | (591.3) | (299.2) | (155.6) | 203.8 ($135.8M) |
| Battery-segment operating profit/(loss) | (630.1) | (338.5) | (176.6) | 159.3 ($106.2M) |
| Consolidated AMPC | 19.5 | 79.8 | 80.5 | 107.7 |
| Consolidated ex-AMPC | (610.8) | (379.0) | (236.1) | 96.1 |
| Battery-segment ex-AMPC | — | — | — | — |
| Operating cash flow | — | — | — | ~24 ⁴ |
| Utilization | — | — | — | 73% ⁵ |
| ASP direction | — | — | — | — |
| EV/ESS mix | — | — | — | — |
⁴ Arithmetically derived: H1 consolidated OCF (KRW 109.4B) minus Q1 (KRW 85.2B). Not separately disclosed. Consolidated, not battery-segment. ⁵ H1 2026 figure, not Q2-specific. Covers small-battery unit production at Cheonan and Tianjin, not automotive or ESS lines (Issue #12 sidebar).
SK On — trailing four quarters
SK On is reported as a battery business within SK Innovation's consolidated disclosure. Q1 2026 revenue was restated in the Q2 deck to include other operating income; Q3 and Q4 2025 were not restated.
| KRW billion | Q3 2025 | Q4 2025 | Q1 2026 | Q2 2026 |
|---|---|---|---|---|
| Revenue | 1,808 | 1,457 | 1,870 ⁶ | 2,946 ($1.96B) |
| Operating profit/(loss) | (124.8) | (441.4) | (349.2) | 821.8 ($547.7M) |
| AMPC | 173.1 | 101.3 | — ⁷ | — ⁷ |
| Ex-AMPC result | (297.9) | (542.7) | — | — |
| Customer compensation | — | — | — | Named, not quantified |
| Operating cash flow | — | — | — | — |
| Utilization | — | — | — | 36.4% ⁸ |
| ASP direction | — | — | — | — |
| EV/ESS mix | — | — | — | — |
⁶ Restated from originally reported KRW 1,791.2B. ⁷ SK Innovation stopped disclosing quarterly AMPC for the battery segment after Q4 2025. ⁸ H1 2026 figure, not Q2-specific. Load-hours divided by operating-hours; not comparable to LGES or Samsung SDI methodology (Issue #12 sidebar).
Incentive isolation
LGES is the only one of the three where the ex-incentive bridge can be built entirely from disclosed figures, and the four-quarter trajectory is coherent: the underlying loss widened from KRW 236B in Q3 2025 to KRW 455B in Q4, narrowed to KRW 398B in Q1 2026, then narrowed again to KRW 128B in Q2. That KRW 270B QoQ improvement in the ex-incentive result is the strongest evidence of real manufacturing economics improvement anywhere in this set — and the only such evidence that can be verified rather than inferred.
Samsung SDI's consolidated ex-AMPC result crossed zero in Q2 at KRW 96.1B. That figure includes an unquantified tariff refund and covers electronic materials alongside batteries. The battery segment itself posted KRW 159.3B operating profit, but how much of the KRW 107.7B consolidated AMPC belongs to batteries, and how much of the refund, is not disclosed. Hence the blank cell. Separately, the Q3-to-Q4 2025 AMPC jump from KRW 19.5B to KRW 79.8B, attributed to the battery segment's narrower loss without further explanation, was never resolved. AMPC has since settled into a KRW 80–108B range, so the step-change is behind us, but it remains unexplained.
SK On is the least tractable of the three. The company disclosed AMPC through Q4 2025 and then stopped. Management attributed the KRW 1.17T QoQ swing to higher Asian sales, customer compensation, and increased AMPC: three drivers, none sized. The Q1 and Q2 ex-AMPC cells are blank because the inputs do not exist in the public record. A swing of that magnitude with undisclosed composition cannot be carried into a supplier assessment — the non-recurring share is unknown and could plausibly account for most of it.
Utilization
No company disclosed a quarterly utilization rate for any of these four quarters. The H1 2026 figures that do exist — LGES at 52.8%, Samsung at 73%, SK On at 36.4% — measure different things: value-based output across facilities, small-cell unit production at named plants, and load-hours over operating-hours. Ranking them against each other produces nothing.
Each figure carries a directional signal against its own history, with the caveat that measurement bases may have shifted between reporting periods. LGES at 52.8% sits above the 47.6% trough of the 2022–2025 downcycle, consistent with the ESS ramp visible in revenue mix. Samsung SDI's 73% looks like a sharp recovery from roughly 50% in 2025, but the figure covers small-cell lines at Cheonan and Tianjin and says nothing about automotive or ESS utilization, which is where the sourcing question actually sits. SK On's 36.4% is below the roughly 48.7% low reported previously — deterioration, not recovery. Whether that reflects a methodology change, a denominator expanded by new capacity, or genuinely lower throughput cannot be distinguished from what was disclosed.
Whether the rate of decline is decelerating or reversing cannot be determined from semiannual figures. It needs quarterly data none of the three provides.
Guidance vs. actuals
LGES's Q1 call (Korean-language transcript) guided Q2 revenue growth of at least 10% QoQ and targeted a return to ex-IRA operating profitability as ESS capacity stabilized. Revenue grew 15.3% QoQ. The ex-incentive result stayed a KRW 127.7B loss. Top line delivered, direction delivered, the specific ex-incentive breakeven commitment missed for the second consecutive quarter — though the gap narrowed from KRW 398B to KRW 128B. The trajectory is right and the timeline is slipping.
Samsung SDI's Q1 English materials guided toward gradual recovery from Q2 and quarterly profitability in H2 2026. The company reached consolidated and battery-segment profitability in Q2, a quarter ahead of its own timeline. Whether that reflects genuine acceleration or conservative guidance depends on how much of the result came from the tariff refund and AMPC, which returns us to the blank battery-segment cell.
SK Innovation's Q1 materials offered no numerical Q2 target for SK On, so there is nothing to compare.
Cash conversion
LGES generated KRW 25B of operating cash flow in Q2 against KRW 113.3B of reported operating profit and roughly KRW 1.33T of EBITDA. Working capital absorbed KRW 1.185T. The trailing OCF sequence — KRW 1,267B, KRW 1,753B, negative KRW 316B, KRW 25B — shows cash generation collapsing through H1 2026 while the operating result was improving. KRW 25B against a KRW 7.56T revenue base is a rounding artifact. The manufacturing improvement is real; it has not reached the balance sheet.
Samsung SDI's H1 2026 filing reports consolidated operating cash flow of KRW 109.4B for six months against Q1's KRW 85.2B, implying Q2 consolidated OCF near KRW 24B. That is arithmetic, not disclosure; the Q2 IR presentation contains no cash flow statement. Balance sheet movements point the same way: inventory up KRW 376B, receivables up KRW 587B, cash down KRW 232B, borrowings up KRW 457B. KRW 203.8B of reported consolidated operating profit, roughly KRW 24B of cash. These are consolidated figures spanning batteries and electronic materials, so the battery segment's own cash contribution is unknown, but the consolidated picture is clear enough.
SK On does not disclose segment-level operating cash flow. The cell is blank.
LGES: KRW 25B OCF on KRW 113.3B operating profit. Samsung SDI: ~KRW 24B OCF on KRW 203.8B operating profit. SK On: undisclosed. Two out of two disclosing companies converted less than 10% of reported operating profit to cash.
Both companies that disclosed enough to assess produced near-zero operating cash flow in a quarter of reported improvement. A supplier booking profit while funding operations through working capital expansion and additional borrowing carries a different risk profile than one whose improved results reach cash. For anyone assessing supplier financial health this quarter, the cash-conversion figures are more informative than the operating profit figures.
Sourcing decision frame
LGES showed the clearest manufacturing improvement: ex-incentive loss narrowed by KRW 270B QoQ, with a four-quarter trajectory pointed consistently at breakeven. The ESS pivot is scaling — H1 ESS revenue reached 4.6x year-ago levels, with ESS in the high-20% range of company revenue. The exposure is liquidity. Working capital is absorbing the operating improvement, and until that reverses LGES is growing into a tighter cash position. The open question is whether cash catches up before the balance sheet starts constraining the ramp.
Samsung SDI hit profitability a quarter early, but the battery segment's underlying economics stay opaque as long as AMPC and the tariff refund sit unallocated at the consolidated level. Its structural position as the only non-Chinese prismatic supplier with US production is a real compliance advantage for BESS buyers who specifically require that format — and the financial foundation under that position cannot be independently verified from what has been disclosed.
SK On posted the largest absolute improvement and remains the least decomposable: three named drivers, none quantified, no segment cash flow, no quarterly AMPC since Q4 2025. Its US plants serve Hyundai's local production at reportedly high utilization, which is a concentrated but genuine demand anchor. Whether that anchor sustains the business is not answerable from public disclosure.
Treating "Korean makers" as a single improving category is the wrong read from this quarter. The sourcing question is company-specific, and the quality of the data available to answer it ranges from adequate at LGES to partially obscured at Samsung SDI to largely opaque at SK On.
- Samsung's October LFP cells: Samsung SDI's Korean-language Q2 call targeted US prismatic LFP cell production in October 2026, but the L&F cathode supply contract doesn't begin until 2027, leaving the material source for the first production lots unidentified.
- SK On ESS backlog structure: SK On's NeoVolta agreement contains 9 GWh firm and 9 GWh framework, while Flatiron's contains 1 GWh firm and 6.2 GWh right-of-first-offer, and neither is connected to a named production line or qualification status.
- SynergyCells revised economics: Samsung SDI completed its acquisition of GM's 49.99% stake in the New Carlisle JV on August 11, but has not published revised capacity, chemistry allocation, SOP, capex, or customer commitments for the now wholly owned plant.
- Korea's domestic production credit: The Ministry of Trade proposed a battery production tax credit through 2036, but covered products, per-unit credit amounts, and eligibility conditions remain unset, so the measure cannot yet enter current Korean-route cost comparisons.