System Pressure

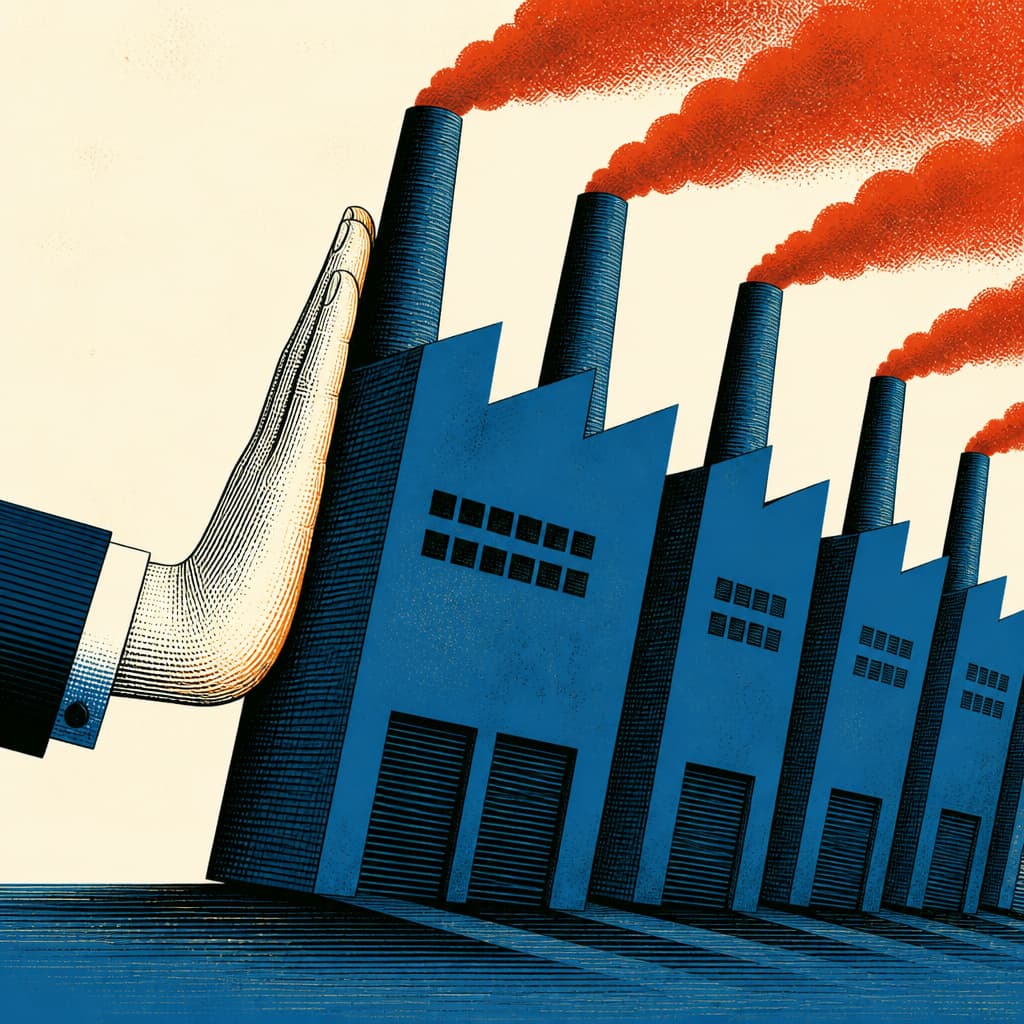
CABIA's January–July 2026 combined power-and-ESS battery data: production 1,286.9 GWh, sales 1,164.6 GWh. The gap is 122.3 GWh, 10.5% of reported sales. Full-year 2025's production-sales difference was 55.1 GWh, 3.2% of sales. Seven months into 2026, the residual has more than doubled the prior year's total.
The widening is rate-driven. Production grew +54.9% YoY through July, sales +48.1%, exports +43.9%, domestic EV installations +15.4%. All four channels are growing. The spread between output growth and each successive absorption channel is widening at each step.
A necessary caveat: the 122.3 GWh is not a physical inventory figure. CABIA publishes no stock measure. The production-minus-sales residual contains timing lags, work in progress, captive OEM transfers, and channel stock in proportions the public series cannot disaggregate.
The rest of this section examines where unabsorbed production is sitting and what determines whether it clears in H2 or compounds.
Chinese Cell Prices Move in Pools


InfoLink's China ESS cell series has printed RMB 0.360/Wh since February. InfoLink's own analysis says 314 Ah prices rose more than 15% over the same period. Both can be true, because they measure different pools — separated by qualification gates, format requirements, and deployment-history thresholds that keep 122.3 GWh of surplus production from flowing where it would compress prices. Two axes organize the system: who can carry surplus and for how long, and which price pools that surplus can reach. The spot floor everyone watches is real, and it carries the least information relevant to a qualified procurement decision.
Chinese Cell Prices Move in Pools
InfoLink's China ESS cell series has printed RMB 0.360/Wh since February. InfoLink's own analysis says 314 Ah prices rose more than 15% over the same period. Both can be true, because they measure different pools — separated by qualification gates, format requirements, and deployment-history thresholds that keep 122.3 GWh of surplus production from flowing where it would compress prices. Two axes organize the system: who can carry surplus and for how long, and which price pools that surplus can reach. The spot floor everyone watches is real, and it carries the least information relevant to a qualified procurement decision.
CATL Doubled Its Finished Goods in Six Months. Dispatched Goods Barely Moved.

CATL's net finished goods rose 111% to RMB 47.6B in H1 2026. Goods dispatched grew 4.7%. Contract liabilities fell 26%. Utilization held at 94.86%. A producer sitting on RMB 372B in monetary funds can carry that surplus indefinitely without discounting, and the near-flat inventory provision means its auditors agree the product moves at cost or better. What that combination points to for buyers is leverage on terms, commitments, and delivery structure rather than on headline price.
CATL Doubled Its Finished Goods in Six Months. Dispatched Goods Barely Moved.
CATL's net finished goods rose 111% to RMB 47.6B in H1 2026. Goods dispatched grew 4.7%. Contract liabilities fell 26%. Utilization held at 94.86%. A producer sitting on RMB 372B in monetary funds can carry that surplus indefinitely without discounting, and the near-flat inventory provision means its auditors agree the product moves at cost or better. What that combination points to for buyers is leverage on terms, commitments, and delivery structure rather than on headline price.