

Ninety percent of American adults told AP-NORC in July 2026 that extreme heat had affected some part of their lives. Two years earlier, the figure was 83 percent. The survey reached 1,165 people and broke the answers out by category:
| Category | 2024 | 2026 |
|---|---|---|
| Exercise routines | 44% | 51% |
| Family outdoor activities | 57% | 68% |
| Travel and vacation plans | 25% | 42% |
| Electricity bills | 69% | 81% |
| Timing of events (weddings, reunions) | 20% | 31% |
Every line moved the same direction, and several moved a long way in two years. Travel and vacation plans gained seventeen points.
What the survey captures is perceived impact rather than specific action. It can't distinguish between someone who started running at dawn and someone who stopped running. But taken together, the numbers describe a population that has changed how it moves, gathers, schedules, and spends. Ask those same people whether they've adapted to climate change and I'd guess most would say no. They haven't raised the house or put panels on the roof. They've rearranged things instead, one adjustment at a time, filing each one under something else: preference, convenience, common sense, the way things are now. The adjustments only look like a single phenomenon when you set them beside each other.
When people move
Americans are compressing outdoor life into narrower, cooler windows of time, and the compression appears to be speeding up.
A 2024 study of Greater Houston used anonymous mobile-phone location data during a 2022 heatwave and found reduced daytime movement, a larger share of activity pushed past 8 p.m., and evening activity delayed by as much as 105 minutes. A shift that size is the difference between walking the dog after dinner and walking the dog after dark, between a neighborhood that's busy at six and one where the sidewalks stay empty until the temperature drops.
A national study published in 2026 matched mobility data to daily weather across the contiguous U.S. for the warm seasons of 2018 through 2024. Routine movement rose through moderate warmth, peaked near 80°F, and then fell. The decline after that peak was steepest in the lowest-income neighborhoods. The people with the least flexibility about when to be outside showed the sharpest contraction when it got hot, which suggests the temporal shift isn't only about preference. Rescheduling your day requires work, childcare, and transportation arrangements that permit rescheduling.
What's missing is the data you'd expect to exist by now. Garmin's 2025 global report showed indoor runs growing faster than outdoor runs, but it doesn't break results out by country or connect activity timing to temperature. No national fitness platform has published a U.S. series showing collective shifts in outdoor exercise timing during heat. The behavioral research says people are withdrawing from hot hours. The granular record of how they're rearranging their schedules around those hours either doesn't exist publicly or hasn't been assembled that way.
That fragmentation is part of why the pattern stays hard to see. Mobility researchers, fitness companies, and public health surveys are each catching a piece of the same reorganization, on different schedules, in different formats, for different purposes. None of the datasets was built with the others in mind.
Where people go
The largest spatial adaptation may be happening inside people's own houses, at a scale no dataset was designed to capture. Households concentrating in one cooled room while the rest stays hot. Sleeping downstairs because the second floor is unbearable in August. Afternoons at the library or the mall, which is commercial air conditioning you didn't have to pay to install. These show up in qualitative reporting and indoor-temperature studies but not in representative behavioral counts, because rearranging your domestic space doesn't produce the kind of signal a smartphone mobility study can detect.
The studies that look at public space tend to support that reading by finding no consistent outward redistribution. A 2026 study of L.A. County parks compared smartphone locations on extreme-heat days against control days and found park use slightly lower during heat. Coastal and beach visitation was higher on one extreme-heat Saturday, but there was no consistent countywide pattern and no sign that people were systematically relocating to parks as cooling refuges. Day of the week and time of day predicted attendance better than temperature did. A Pacific Northwest study of 91 protected areas between 2017 and 2021 found that higher particulate concentrations reduced visits, while heat raised visitation up to a threshold and then suppressed it, with responses varying by site and by which pollution metric the researchers used.
So: people aren't showing up in public cooling spaces in measurable numbers, and national mobility data shows activity contracting above a heat threshold. What's left is a retreat inward, into whatever cooled space is available, which for most households means one or two rooms of their own home. That reshapes how families live, and it happens behind closed doors, one household at a time, invisible to any survey that counts park visits or tracks devices across a city.
How people gather
The social numbers moved fastest. The share of adults reporting that heat affected the timing of weddings, reunions, and similar events went from 20 to 31 percent in two years. In the West, the share reporting a major impact on event timing rose from 7 to 18 percent. More than two-thirds said family outdoor activities were affected: the cookout that moves inside, the outdoor birthday party reconsidered when the forecast hits triple digits.
A survey of 127 outdoor recreation and tourism organizations, mostly North American but more than half Canadian, found that 86 percent reported new impacts from extreme heat in 2023 and 39 percent revised operating plans on at least 11 days. More than half lost access to an operating area. These are the organizations that host the gatherings, and they're improvising: rescheduling, relocating, canceling, substituting something indoors. Only 31 to 47 percent had formal criteria for when to call it off. The adjustments are running well ahead of the rules that would govern them.
The wedding industry, which you'd expect to track this closely given the money involved, publishes no comparable national data on heat-related changes. The Knot's annual research covers costs, guest counts, and planning practices, not climate disruptions. An industry built on outdoor summer events hasn't developed, or at least hasn't released, systematic tracking of the conditions reshaping when and where those events can happen.
Youth sports may be furthest along. An Aspen Institute survey of 1,848 parents found that teams canceled an average of 2.4 practice or competition days because of very hot temperatures, and nearly seven days total once smoke, flooding, and changing winters were included. The estimates were widely dispersed and based on parental recollection rather than league records, so treat the averages loosely. The finding that stays with me is that nearly half of parents said they'd accept moving their child's primary sport to a different season if weather disruptions continued. That's a near-majority open to rearranging the calendar of American childhood athletics around conditions that weren't part of the conversation a generation ago. In the survey, it reads as a scheduling preference.
What people spend
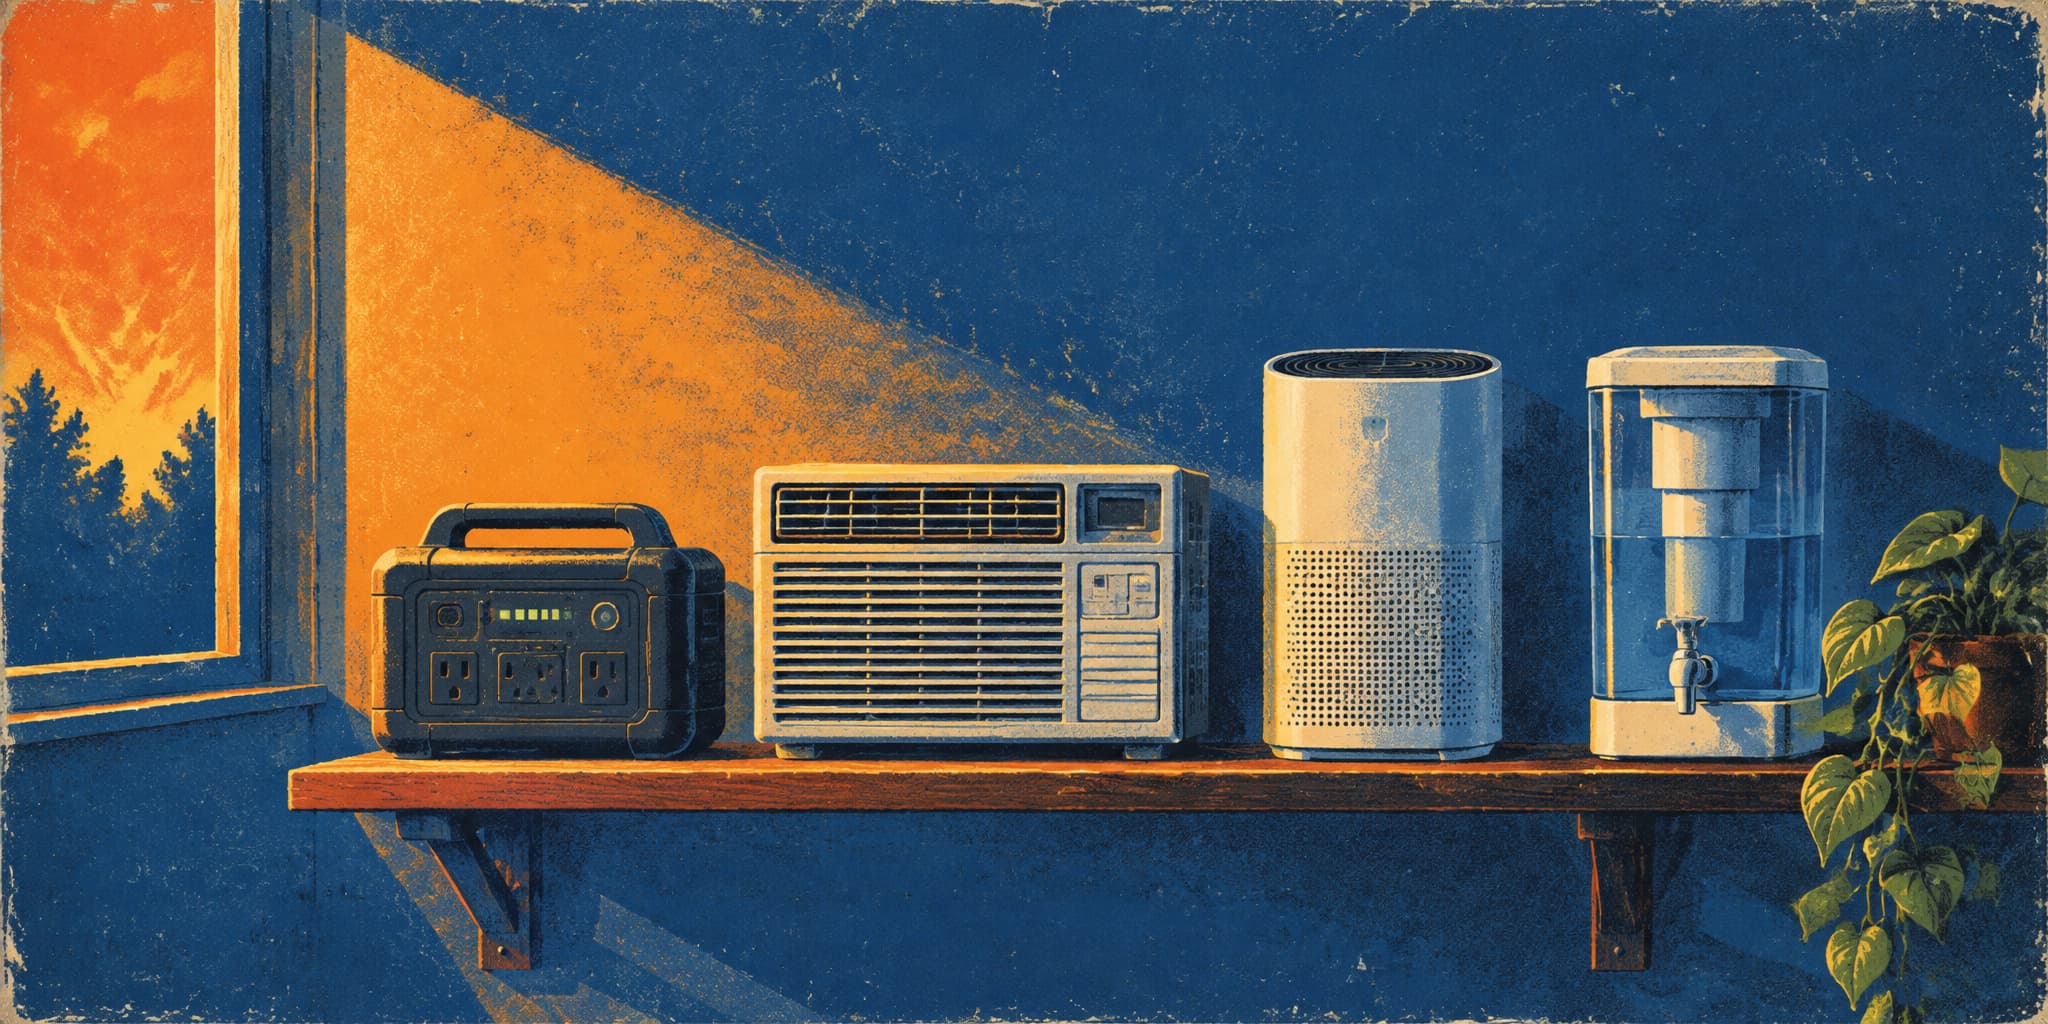
In an earlier piece for this publication I inventoried the objects on my own shelf, which by then included a portable power station, an air purifier, a window AC unit, a water filter, and a weather radio. What I'd assembled one purchase at a time turned out to be a small private utility system I'd never planned to build. Each purchase solved a specific afternoon. Nothing in the process required me to think of the collection as a category, and I never budgeted for it as one.
The national numbers suggest the shelf isn't unusual. Preliminary 2024 federal survey data estimate 6.6 million U.S. homes with a standby generator and 20.3 million with a portable one. Harvard's Joint Center for Housing Studies, working from a different survey, reported generator ownership among single-family homeowners rising from 21 percent in 2013 to 25 percent in 2023. The EPA recorded 7 million ENERGY STAR air-cleaner shipments in 2023, up from 5.4 million the year before.
These are large numbers that don't all move together; certified room air conditioner shipments actually fell between 2022 and 2023. And shipments can't tell you why anyone bought anything. A CDC survey of air purifier users found 88.8 percent citing dust, pollen, mold, or allergens, 51.6 percent citing viruses, and 38.3 percent citing smoke particles. People described the same machine through several rationales at once, which is roughly how I'd describe my own purchases if pressed. Among people who didn't own one, 59 percent said purifiers were too expensive, and among renters it was 66 percent.
Then there's the electricity bill, the financial signal that's hardest to ignore and easiest to misattribute. Air conditioning already accounts for roughly 19 percent of U.S. residential electricity. Cooling-degree days, the standard measure of how far temperatures exceed 65°F and therefore how hard AC systems have to work, rose 10 percent in 2024, and the EIA attributed a 3 percent increase in residential electricity purchases to warmer summers. In the AP-NORC survey, 46 percent of adults said heat had a major effect on their electricity bills, up from 39 percent. In the Midwest, major bill impacts jumped from 29 to 44 percent.
That's real money moving through household budgets under the heading of "utilities." The bill doesn't arrive with a line that reads climate surcharge. It arrives higher, you pay it, you maybe nudge the thermostat up a degree, and none of it is counted anywhere as adaptation spending.
The labeling gap
The housing market shows the distance between what people want and what they're willing to call it.
Zillow's 2024 survey found 83 percent of recent buyers rating air conditioning very or extremely important, 72 percent saying the same about watertight windows and roofs, and 86 percent rating at least one resilience feature that way. Forty-three percent considered only low-flood-risk areas. Twenty-eight percent avoided wildfire-prone homes.
A May 2026 Redfin-Ipsos survey of people planning to move asked which features they wanted. High-end air or water filtration was a top-three priority for 36 percent. Backup power, solar or generator, was selected by 19 percent. The category named "climate resilient upgrades or features" was chosen by 14 percent.
More than twice as many people wanted the specific functions of climate adaptation as wanted the label.
Demand for filtration, backup power, a stronger building envelope, and a lower-risk location is real and rising. Willingness to call that set of preferences by its name trails well behind.
The National Association of Realtors found that 44 percent of multiple-listing services included green-data fields, and that 47 percent of agents with access to those fields didn't use them. Fifty-eight percent of agents said fewer than a quarter of their clients considered climate risk during a purchase, even while agents themselves rated severe-weather impacts and indoor air quality as important client concerns. The vocabulary is already built into the paperwork. It's sitting there unused.
What this evidence can and can't support
The limits are worth stating plainly. AP-NORC measures perceived impact, not verified behavior. The mobility studies measure devices moving, not decisions. Shipment counts record products sold, which is not the same as protection delivered. As Seth Carrington documented in this publication, air conditioning was present in the overwhelming majority of Maricopa County's indoor heat deaths, and in most of those cases it wasn't running. Owning the machine and being protected by it are two different facts, and a lot of the risk sits in the distance between them.
The evidence is thinnest exactly where you'd want it strongest: individual rooms, individual schedules, the decision about whether to hold the barbecue outside or move it in. The most intimate rearrangements, which room you sleep in, which hours you'll let your kids play outside, whether you skip the block party because it's 98 degrees and nobody says that's why, fall below the threshold of any national dataset.
Still, every domain that has been measured points the same way. Less movement during heat, activity pushed into cooler hours, gatherings shortened or relocated or dropped, more generators and purifiers and filters in American houses, higher cooling bills, house hunters asking for backup power. Each gets filed under its own heading — personal preference, home improvement, comfort, health — and that keeps every piece of it isolated from every other piece.
I keep wondering what would change if the pattern had a name. Possibly nothing in the short run; people would go on doing what they're doing. But unnamed things tend not to get funded, planned for, or distributed with much attention to who's getting what. The person who can afford a $1,400 battery backup and the person who can't are responding to the same summer, and only one of them can respond privately. When adaptation is something you buy rather than something a place organizes, the question of who can afford it never quite has to be asked out loud. It's there in the income gradient of who stops moving when it gets hot, in the 66 percent of renters who say air purifiers cost too much, in the gap between having an air conditioner and having one that runs.
Ninety percent of American adults say heat has affected their lives. I'd like to know what they'd call it, if anyone asked them to name it.
-
Three cities, three definitions: New York, Houston, and Washington, D.C., all enacted cooling protections in 2026, but each law protects something different — a bedroom temperature ceiling, an equipment capability standard, or an eviction calendar, raising the question of what "cooling protection" actually means for a tenant's body.
-
Schools that stay open: A GAO survey estimated that one in five public-school districts canceled at least one day for a facility emergency in 2024–25, but the schools that stayed open by moving classes to cafeterias or asking sweaty children to sit quietly may tell us more about where the cost of heat actually lands.
-
Maui's rising rent clock: Hawaiʻi extended FEMA temporary housing for wildfire survivors through February 2027, but the extension came with an escalating rent schedule — minimum 25 percent of fair market rent in March, 50 percent by September — turning continued shelter into a new monthly obligation.
-
Owned but not working: The distance between equipment ownership and actual protection is documented most starkly in Maricopa County's indoor heat-death records, where air conditioning was present in the vast majority of cases but nonfunctioning in most, a finding that complicates every national count of installed systems.