
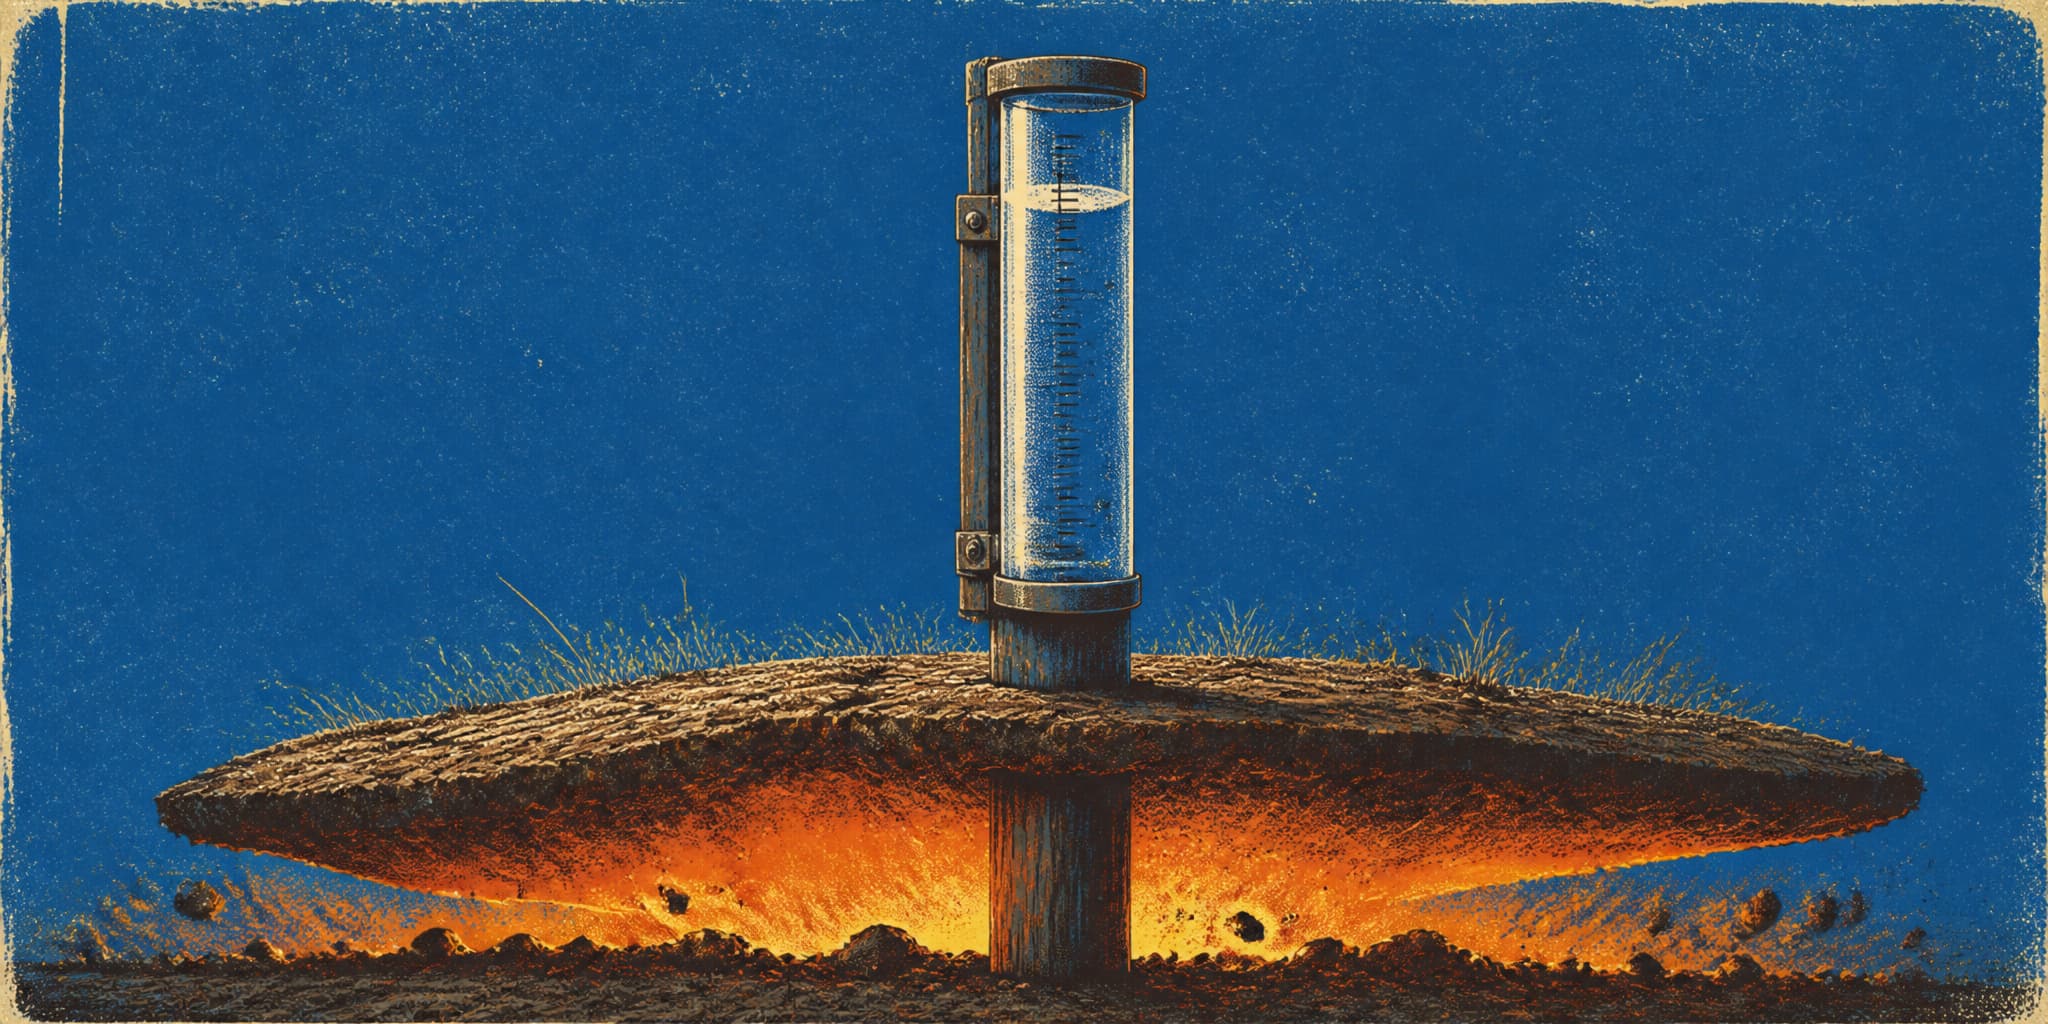
A rain gauge is a bucket with a ruler in it. That is the whole of its engineering and the whole of its limitation. It catches what falls, it reports how deep the water stood, and once a year somebody sums the column and hands over a number that immediately goes to work. Loan committees lean on it. Lease negotiations quote it. It rides along on appraisals, crop budgets and extension tables, and in the head of every irrigator who has ever stopped at a pivot point to squint at a cloud and run the arithmetic.
Soil cannot read a bucket. It has no mechanism for accepting depth. What soil accepts is a rate, and depth and rate do not convert into one another.
That failure to convert is the subject of a paper published in Nature on May 13, 2026 by Corey Lesk and Justin Mankin of Dartmouth. Peer-reviewed, version of record, not a preprint. The finding is short. When a year's rain shows up in fewer and heavier deliveries, the land holds on to less of it, and that stays true after you control for how much fell in total. More rain, less water.
They put a number on unevenness using a Gini coefficient, the statistic economists point at household income, aimed instead at the days of a year. A zero would mean every day got an identical sliver. A one would mean the entire year arrived in a single afternoon. Real places sit between, the value wobbles from year to year, and Lesk and Mankin asked what the water stored in the land was doing while it wobbled.
The answer comes in standardized units, meaning each figure is scaled against a normal year-to-year swing in whatever it measures. For a place that usually gets around a thousand millimeters, call it thirty-nine inches:
| One ordinary jump in… | Effect on stored water |
|---|---|
| Rainfall unevenness | −0.16 of an ordinary swing |
| Total rainfall | +0.20 of an ordinary swing |
Set those two figures beside each other and the shape of the problem is visible. Concentration works at roughly eighty percent the strength of the annual total, pointing the opposite direction. A year can be wetter and lumpier at the same time, and read as good news at the gauge and as approximately nothing at the root zone.
Thirty minutes on a silt loam
The irrigated ground of western Kansas is mostly silt the wind put there, the Colby and Ulysses series among it, better than five million acres, occurring almost nowhere that annual precipitation runs above eighteen inches. USDA's official description of Ulysses mentions, in the flat register of a soil scientist noting the local weather, that most of its rain comes down in high-intensity convective thunderstorms between late spring and early fall. Nobody filed that as a warning. It sits there as background.
For irrigation design, USDA's engineers give silt loam an intake range of one-tenth to six-tenths of an inch per hour.
Now put weather on it that cooperates. A slow rain never stands on the ground; it goes in continuously, and two hours along you can dig a hole and find the wetting front, a level boundary a few inches down where dark soil meets pale soil, working lower at a speed the pores can actually manage. Arriving and being received are the same event. Nothing pools. Nothing shines. From the road the field looks like it is barely raining, which is precisely the point.
At the Kansas State research station in western Kansas, researchers set a rainfall simulator over a Harney silt loam and ran it at four and a half inches per hour for half an hour, an intensity they characterized as a twenty-five-year storm for that country.
Seven and a half times the top of the intake range. Forty-five times the bottom. That is the entire physical argument and it takes no hydrology to feel it. A pipe has a throughput and the delivery arrived at multiples of it. Rated for a garden hose. Plumbed by a fire department. Mankin reached for the same image in an interview with his campus paper, saying concentrated rain is "effectively asking the land surface to drink from a fire hose." The project began, he said, as a narrower question about whether heavier rain would simply hang up in plant canopies, and kept widening from there.
What becomes of the overage is worse than spillover, because the surface stops being a surface while you stand there watching it. Drops falling at that rate land hard enough to knock particles loose. The loosened fines wash straight into the pores underneath and pack them. Inside a few minutes the top two or three millimeters of a tilled field have gone from filter to lid, and the intake value the planning tables assigned that soil no longer describes anything present in the field. Come back the next afternoon and you can slide a knife under the crust and lift a plate of it off the ground like the top of a pie.
The Kansas trials found runoff starting earlier the more wheat or sorghum stubble they stripped off the plots. Fresh-tilled ground drank faster to begin with, then consolidated, sealed, and shed water as fast as untilled ground or faster. Loose soil is not absorbent soil; it is soil with more material available to move.
Antecedent condition compounds all of this in both directions, which is the part that tends to catch people. Ground already saturated from a storm three days back sheds water because there is nowhere left to put it. Ground baked hard and crusted sheds water because the door is shut. Soaked and bone-dry fail the same test for opposite reasons, and the comfortable middle, moisture in the profile with structure still intact, is the condition the intake tables quietly assume. None of that resolves at the scale of a water year, which is the scale the Nature analysis works at, and the authors say so themselves.
Nowhere in the soil-survey or extension record could I find a minute-by-minute sealing curve for Ulysses silt loam under a thunderstorm, which is its own small finding. For the general shape there is Nebraska extension work on a comparable Hastings silt loam: intake starts near an inch and a half per hour, falls below half an inch inside two hours, settles toward a quarter. Furrow irrigation, no raindrop impact, so take it as the principle rather than the local figure. The principle is that intake is not something a soil has. It is a condition a soil is in. It degrades while the event is happening, and the tables were written as though it held still.
The January round
The limitation first, because it is a real one.
Lesk and Mankin work at the scale of continental river basins. They find significant relationships in 84 percent of the major basins examined, four-fifths of those negative, and they name the Mississippi as one where more concentrated rain travels with less stored water. Western Kansas drains into that system, eventually. Their paper contains no High Plains Aquifer coefficient, no Arkansas subbasin, nothing resolved to a state or a county. The thousand-millimeter reference behind their headline figure is more than twice what falls on Tribune, Kansas. Walking the finding down to a quarter-section in Greeley County is my extrapolation, not their result.
With that on the table: the pairing is sitting in the public record already, and there is a person whose job is writing down the half of it that no bucket reports.
Every January the Kansas Geological Survey and the state's Division of Water Resources go out to the wells. January because the pumps are off then and the water table is as close as it gets to telling the truth about itself, unsmeared by a season of irrigation. The instrument is a steel tape and a stick of carpenter's chalk. You chalk the bottom few feet, pay the tape down the casing until you feel the reel go slack, haul it back, read the line where the chalk went wet, subtract, write the figure on a clipboard, drive to the next one. Hundreds of wells, most of them in the Ogallala, across a winter. I have done a version of this work in a different basin, and what stays with you is how thoroughly ordinary it is. Nothing in the procedure hints that you are manufacturing a number anybody will fight over.
Brownie Wilson was the Survey's water-data manager the year the numbers came back strange.
| Western Kansas, 2019 | Reading |
|---|---|
| Precipitation, K-State Tribune station | 19.59 in |
| 1981–2010 normal, same station | 17.90 in |
| Water-level change, Groundwater Management District 1 (five counties) | −0.16 ft |
| Water-level change, district covering the heaviest-pumping counties | −0.89 ft |
Wet by nearly ten percent against the baseline the station's own annual summary uses. Then the January round came in. Two inches down across five counties, in a year the bucket had called generous. Farther southwest, closer to a foot.
Wilson's summary of that year, in the Survey's own release, runs one flat sentence:
"Southwest Kansas actually finished the year, precipitation-wise, pretty close to normal."
That is a hydrologist holding two instruments up against each other and declining to editorialize about the distance between them, and it is very nearly the only voice on offer. I went looking for a producer on the record describing a rain that ran off instead of soaking in. The indexed proceedings of the Wichita County local management area, the district's annual reports, the board minutes: nothing named. The frustration is presumably in the room. It is not in the transcript, which I recognize from a previous career spent writing reports for clients who filed them as liability documentation.
The pairing's own limits belong out loud too. Tribune is one gauge. The 0.16 feet is an average across wells scattered over five counties. Nothing in the comparison separates rainfall distribution from pumping, and pumping remains the dominant term in any Ogallala water-level change by a wide margin. Above-normal rain and continued decline shared a single year, and causation lives somewhere else.
The water that isn't runoff
Water that doesn't go in has to be somewhere, and this is where the research is genuinely unfinished, which is the part I trust most.
Their mechanism has intense rain shunting water into shallow surface ponding, and ponded water is exposed in a way soil water never is. A film standing on a sealed crust has essentially nothing between it and the atmosphere. Thin, spread wide, warming, sitting there through the clear scalding hours that follow a convective storm the way they always follow. A meaningful share of it goes straight back up.
You would expect the remainder to turn up as runoff. In their numbers it doesn't. They report no significant aggregate response in total runoff and say plainly that this cuts against basin-scale studies that find one. Their explanation is bookkeeping. Their framework counts ponded water as a store that can evaporate before it crosses any boundary; some models file that same water as runoff the instant it fails to infiltrate. Two ledgers. Two answers. One puddle. They also flag their evaporation evidence in arid regions as unresolved, and they name what would settle it: flux towers, soil probes, gauged catchments. Instruments in dirt.
One finding inside the paper corrects something I brought to it. In The Night Is Breaking I argued that the interval between stresses is infrastructure in its own right, and that the recovery half of a cycle degrades faster than the stress half because nobody was ever assigned to watch it. Concentrated rain stretches the dry gaps, and I expected the gap to be doing most of the damage. Lesk and Mankin pry the two apart, separating the extra sunshine that added dry days permit from the partitioning caused by intensity itself, and intensity carries more than half the storage effect in every climate class and nearly all of it in arid ones. The bonus radiation matters most in wet places, where energy rather than water is the ingredient in short supply. The interval hasn't been demoted so much as reassigned, from thief to accomplice: intensity puts the water into a shallow, warm, wide-open reservoir, and the long sunny stretch afterward empties it. The two do not come apart cleanly, and the paper says so.
Where the projections stop agreeing
The observed record leans one way. The Fifth National Climate Assessment reports the share of precipitation falling on the heaviest one percent of days up 21 percent in the Southern Great Plains between 1958 and 2021. Real, and noticeably softer than the 45 percent in the Midwest or the 60 percent in the Northeast. On a different measure, days delivering at least two inches, western Kansas is up 28 percent since 1900, off a base of roughly one such day a year, with only two years in the whole record clearing two of them. Enormous variability wrapped around a trend.
Look forward and it comes apart. At two degrees of warming, the assessment's downscaled maps have most extreme-precipitation metrics rising nationally while showing decreases in some annual and five-year maximum daily rainfall measures right over southwestern Kansas, eastern Colorado and northeastern New Mexico. NOAA's Kansas summary projects summer precipitation totals down five to ten percent statewide by midcentury under a high-emissions pathway, with the statistically significant signal in central Kansas. Different metrics, different geographies, and no consensus that this corner of the plains is headed toward the concentration the Midwest is visibly living in already.
So the question stays open, and it stays open in a particular shape. The mechanism is physical and works anywhere rain rate exceeds intake rate, and these soils make that arithmetic easy. Whether the region gets more of those storms is unsettled.
What a rainfall record is evidence of
None of this tells anybody what to plant, and I have no interest in pretending it does.
What it changes is what a rainfall record is evidence of. Standing residue buys infiltration time and costs whatever the residue was worth as feed or as cash. No-till buys structure and costs flexibility. Sorghum instead of corn. Terraces instead of nothing. A deeper well instead of a shallower one. A section bought partly on the strength of a thirty-year precipitation average printed on the appraisal beside a well log. Every one of those is a bet on delivery rate, signed inside a planning apparatus built back when depth was assumed interchangeable with itself. Twenty inches was twenty inches. The useful unit has stopped being inches and become inches per hour, and inches per hour is not the number anybody sums at year's end, prints on an appraisal, or carries into a loan file.
Next January somebody will be back at those casings with a tape and a stick of chalk, paying it out into the dark, writing the figure down. The gauges will go on filling, and they will go on being right about depth.
-
Irrigation as the answer that runs out: Two 2026 papers set the tradeoff against each other — one estimates that holding wheat, maize, rice and barley production steady would require 47 percent more irrigated land at three degrees of warming while only about 60 percent of global cropland could absorb the added withdrawals without deepening scarcity or depletion.
-
Where the well and the satellite disagree: A USGS analysis of 1,510 monitoring wells found longer, more severe groundwater drought across the Southwest and very low trend correlation between well records and GRACE satellite estimates at individual locations, which is why the January tape still matters.
-
Greener and less resilient at once: A July 2026 early-view paper reports that 47.5 percent of the world's semiarid vegetated land is greening while showing a statistical signal of slower recovery from disturbance — a satellite pixel can brighten while the system's ability to come back from the next drought degrades.
-
What survives a dry extreme: A study of 17 crops covering three-quarters of global production found median losses of 10.1 percent for rainfed and 6.8 percent for irrigated production under historically extreme hydroclimatic conditions, with crop switching modeled as avoiding a majority of the rainfed shortfall.
