The Fifty-Day River

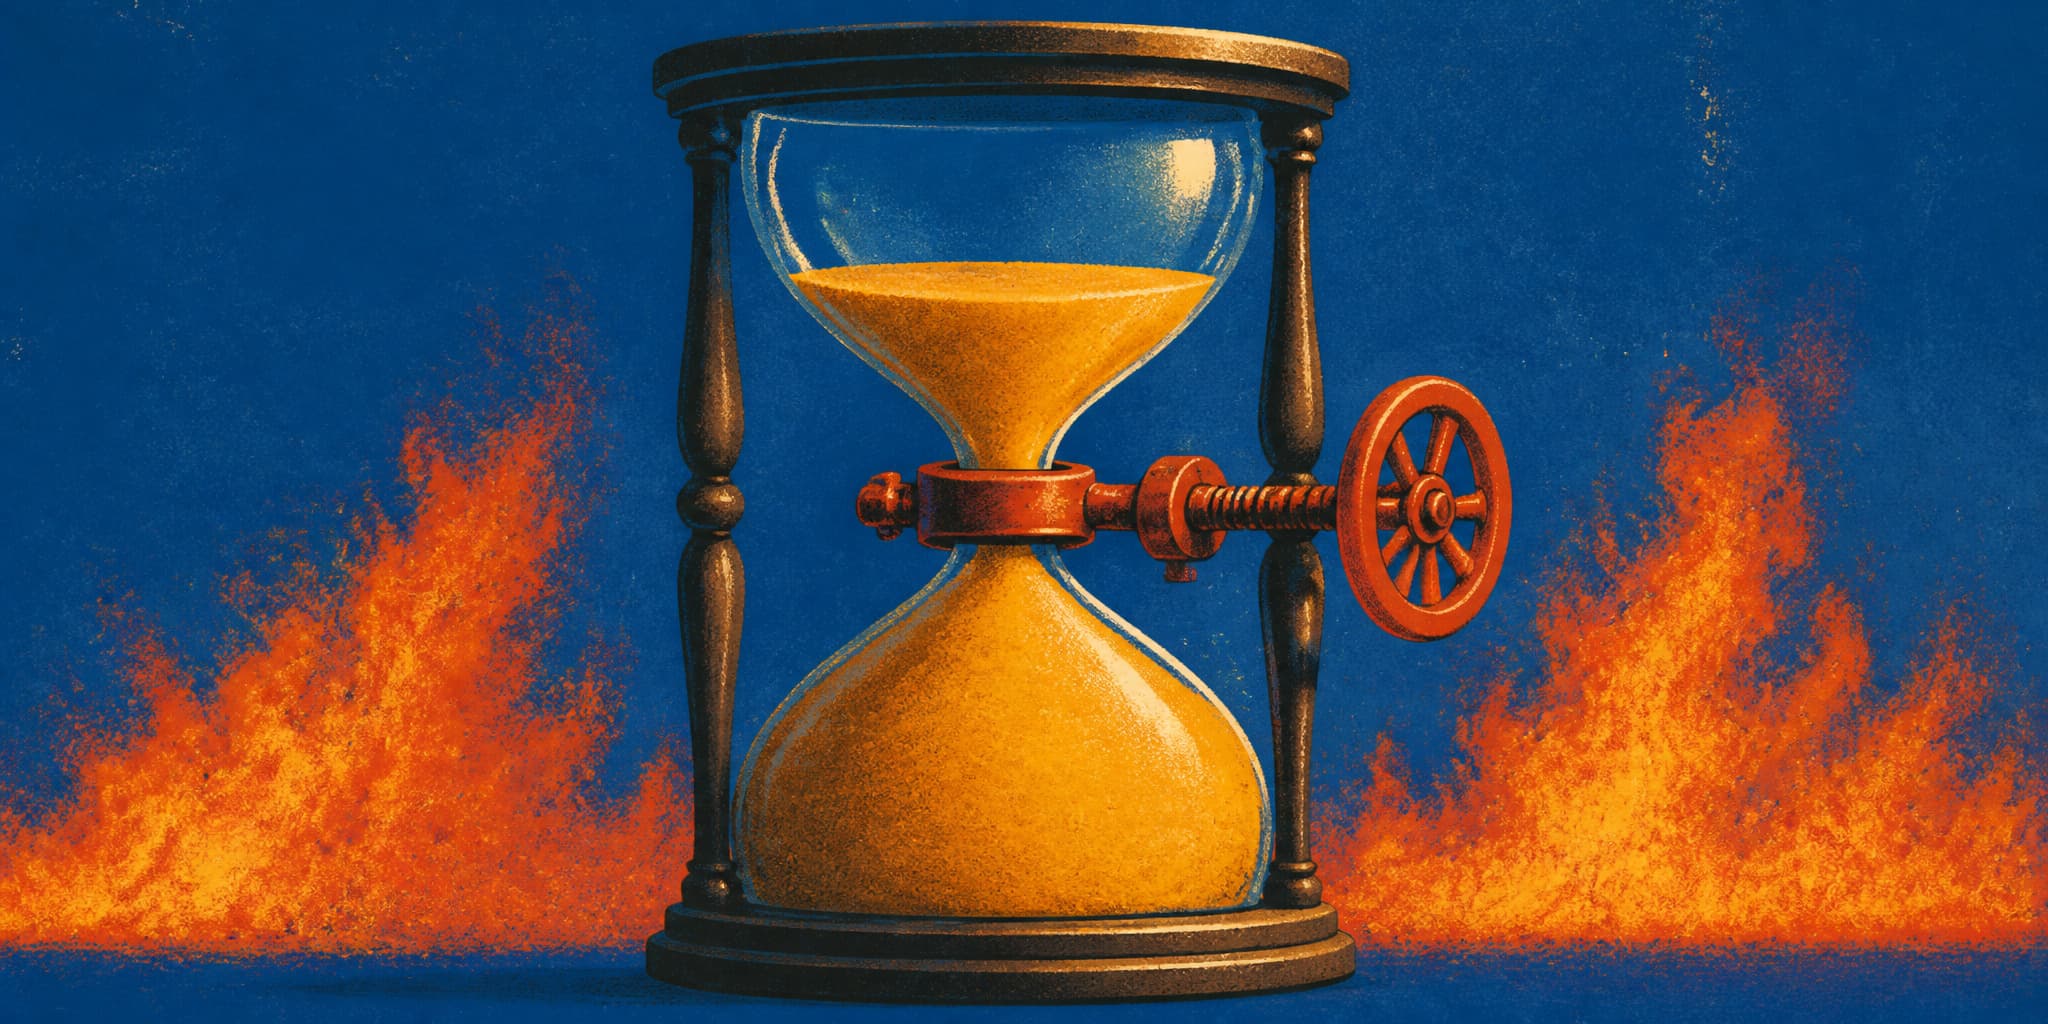
A peer-reviewed study of 175 U.S. rivers finds that the window carrying 90 percent of annual suspended sediment has narrowed from roughly 69 days to 50 over four decades. For most of those rivers the annual total did not rise; the material simply arrived in fewer, harder pulses. Drinking-water treatment plants are sized against historical peaks, and when the peak sharpens, the distance between what a plant can process and what the river delivers on its worst day gets shorter. A May 2025 failure in Richmond, Virginia, documented in detail by state investigators, shows what that shrinking margin looks like in practice.
The Fifty-Day River
A peer-reviewed study of 175 U.S. rivers finds that the window carrying 90 percent of annual suspended sediment has narrowed from roughly 69 days to 50 over four decades. For most of those rivers the annual total did not rise; the material simply arrived in fewer, harder pulses. Drinking-water treatment plants are sized against historical peaks, and when the peak sharpens, the distance between what a plant can process and what the river delivers on its worst day gets shorter. A May 2025 failure in Richmond, Virginia, documented in detail by state investigators, shows what that shrinking margin looks like in practice.
The Research
More Concentrated Precipitation Decreases Terrestrial Water Storage
Three independent precipitation datasets and multiple model frameworks make this the most methodologically rigorous of recent temporal-compression studies.
Concentration alone pushes 27% of global population into abnormally dry conditions, independent of total rainfall changes.
The Research
Flash Droughts Reduce National-Scale Crop Yields in the United States
Flash droughts during reproductive growth cause disproportionate damage, though they occur more frequently during earlier vegetative stages.
Process-based crop models consistently underestimate flash drought damage, which means current yield projections may understate the actual risk.
The Research
Coastal Flooding at Predictable Hours
As levels increase, moderate and major floods will inherit the clock-time predictability currently observed only in minor high-tide events.
Gulf Coast cities show weak clustering because small tidal ranges and hurricane surges overwhelm the tidal signal driving predictability.
The Research
Fire Weather Waves Drive Extreme Fires Globally
Fire weather wave occurrence has increased significantly across most burnable lands since 1979, with projections showing continued growth through the century.
Fire weather is a necessary condition, not a sufficient one — ignition sources, fuel loads, and suppression capacity all mediate actual fire outcomes.
Second Window
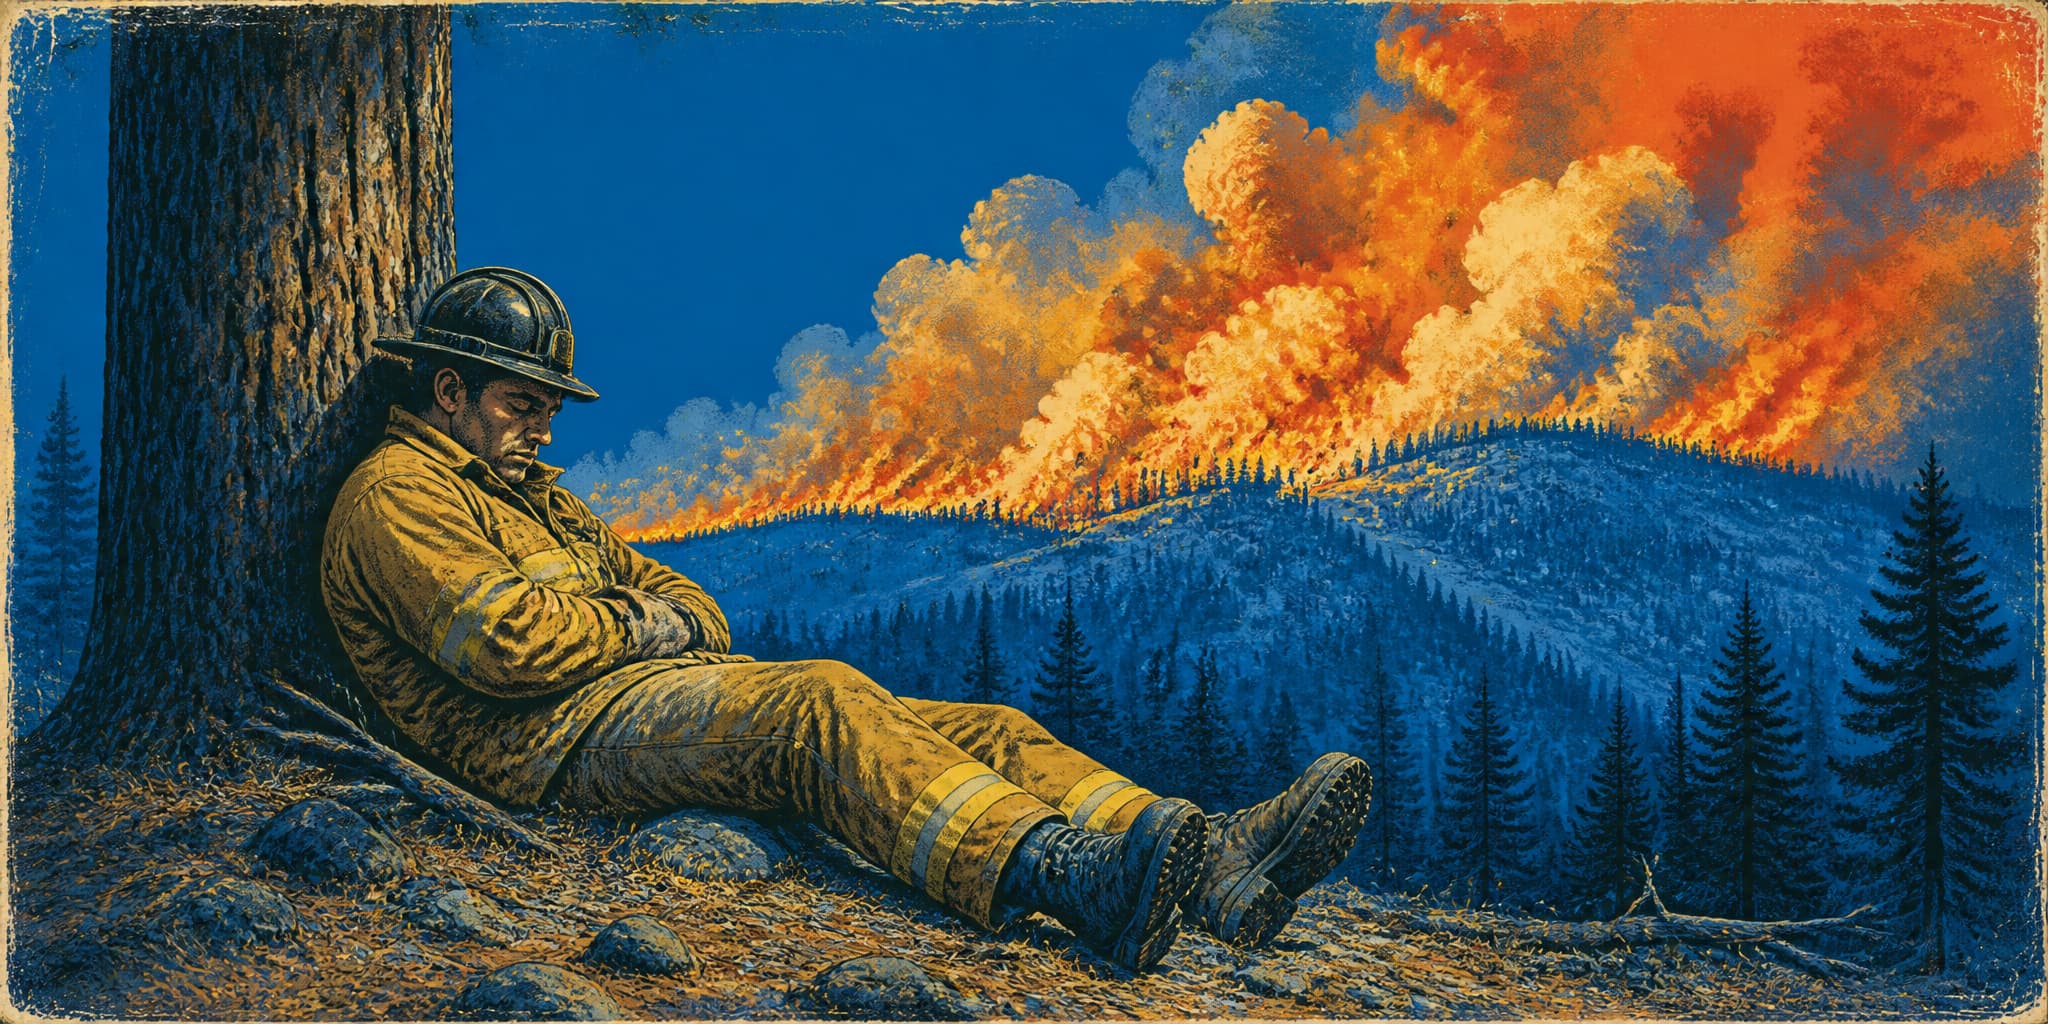
A study published last month in Communications Earth & Environment identifies fire-weather waves — sustained stretches where hot, dry, and windy conditions overlap. Across global forested regions from 1979 to 2024, these waves occupied 4% of days but coincided with 26% of burned area and roughly half of the most intense fires. They are becoming more frequent.
The U.S. is living inside one now. Early August brought the highest national alert level: 102 uncontained large fires, over 29,000 personnel deployed, international crews supplementing from Australia and New Zealand, military aircraft staged in Oregon and California. Some new ignitions may get no initial-attack response — the brief window when a fire is still small enough to catch.
Every system downstream assumes the danger will break. Wildland crews rotate on 14-day assignments. EPA guidance frames cleaner-air shelters as "short periods (hours) of respite." Jasper, Alberta, stayed evacuated for 24 days last summer. The wave pattern raises a practical question for anyone in fire country: what happens to crew fatigue, shelter air quality, and evacuation timelines when dangerous conditions persist for weeks instead of days?