

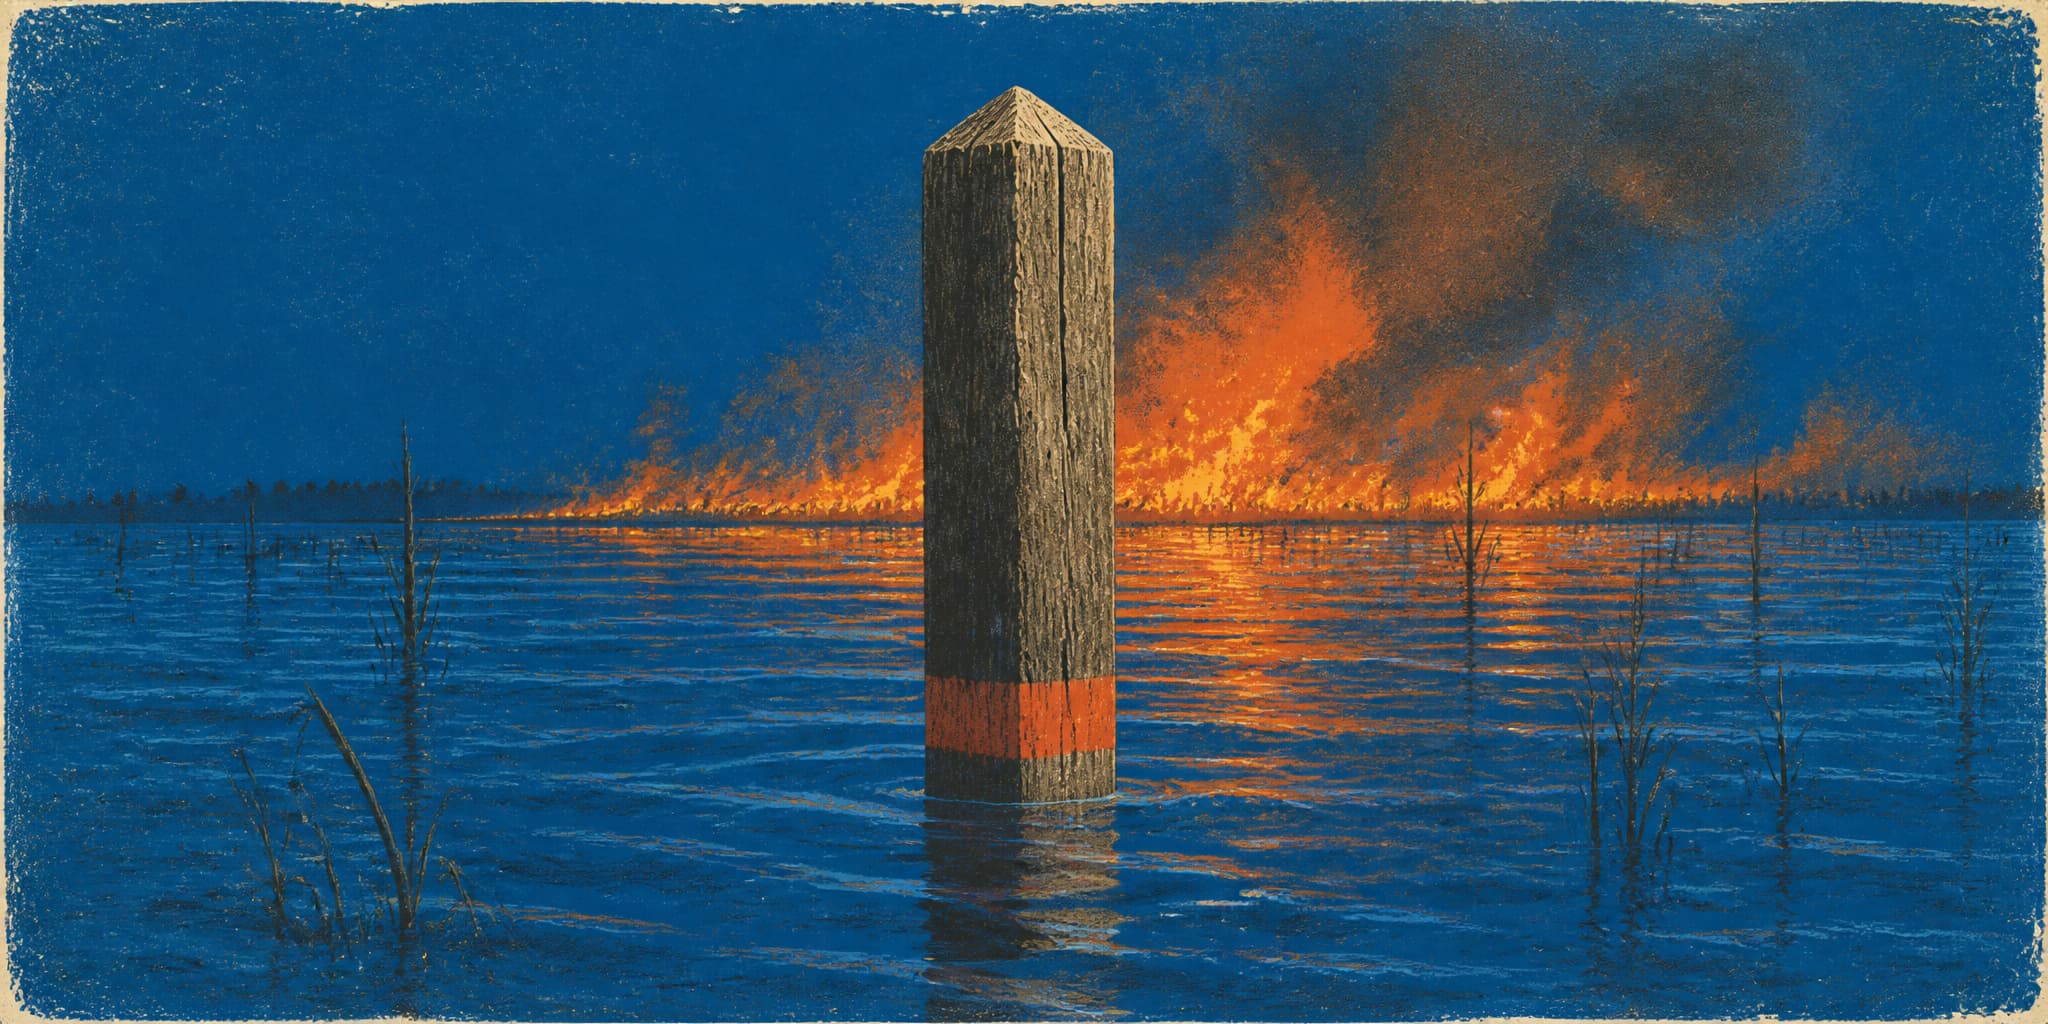
The line on the map
There are days in Charleston, South Carolina when the storm drains run backwards. No storm, no rain, nothing on the news. The tide comes up past a threshold, water pushes up through the grates into the low streets downtown, and a few hours later it goes back where it came from. NOAA expects twelve to seventeen of those days at the city's gauge over the coming year.
None of that is what Charleston's flood maps describe. The maps describe the statistical extreme, the 1%-annual-chance flood, and the boundary they draw around it.
Caroline Schnell is the city's floodplain manager, which means her office administers that boundary. It's called the Special Flood Hazard Area: every parcel where FEMA has determined the annual chance of flooding meets or exceeds 1%. Elevation certificates, development permits, substantial-improvement determinations, all of it runs through her staff, and all of it turns on which side of the line a property sits. Charleston's current maps took effect January 29, 2021. By FEMA's standards that counts as recent.
What the boundary decides is concrete. Inside it, a federally backed mortgage requires flood insurance before the lender can close. New construction has to meet elevation standards, which in Charleston means two feet above FEMA's Base Flood Elevation, a local requirement the city set above the federal floor. Renovate a building for more than half its assessed value and the whole structure has to come up to those standards. Outside the line the federal mandates fall away, though the city points out that every property in Charleston sits in some mapped flood zone. The extra two feet of freeboard is the city's own quiet statement that the federal number isn't sufficient.
The number came from a group of specialists who spent about a day and a half on it in December 1968. It was in federal regulation by 1971 and attached to mortgage law by 1973, and it now governs billions of dollars in property decisions across the country.
At Charleston's tide gauge, the extreme water level that carried a 1% annual probability in 1900 had become roughly a one-in-eight-year event by 2005.
December 1968
"Hundred-year flood" sounds like a promise about the calendar. It isn't one. It describes a probability: a 1% chance in any given year, calculated from the record of how high water has gone at a particular place. Stretch that across a 30-year mortgage, which is the span that makes the number relevant to most people who ever encounter it, and the compounded odds come to about 26%. Roughly one in four. Most people who use the term don't know this, including a good many professionals who build careers around the maps. The name is doing the damage. "Hundred-year" reads as a frequency when what it encodes is an annual probability.
A 1%-annual-chance flood has roughly a 26% probability of occurring at least once during a 30-year mortgage — about one in four.
Hydrologists had been using return-period language for a long time before it became regulatory infrastructure. The Tennessee Valley Authority planned around an "intermediate regional flood." Other agencies used other intervals for other purposes. What didn't exist before 1968 was a single national threshold deciding where the federal government would sell insurance, where lenders would demand it, and where local governments would regulate what got built.
The National Flood Insurance Act of 1968 created the program and left the threshold blank. HUD contracted with the University of Chicago to fill it in. About fifty specialists convened December 16–18, 1968, in a seminar chaired by the geographer Gilbert White, and worked through the candidates: the Standard Project Flood, the Maximum Probable Flood, the Flood of Record, several frequency-based options. At least one participant argued that communities should set their own levels. The group decided a uniform national criterion would be easier to administer for a program that did not yet exist.
They chose the 1% annual-chance flood. A participant later recalled that the deliberation ran about a day and a half and that nobody performed an economic analysis. The National Academies' account of the decision says the threshold was picked partly because some agencies were already using it, partly because it represented a level of risk thought worth protecting against, and partly because it sat in a workable middle: big enough to mean something, small enough to be politically survivable. It was a compromise made under a deadline, and the people making it knew that. The alternative on the table was no standard at all.
By September 1971 the Federal Insurance Administration had tied NFIP regulation to it.
How a probability becomes a building code
The 1968 Act built the program. The Flood Disaster Protection Act of 1973 made it hard to avoid.
Communities taking federal assistance now had to join the NFIP and enforce floodplain ordinances. Property owners holding federally backed mortgages inside the identified hazard area had to buy flood insurance. The law also pushed the nationwide identification and mapping of flood-prone areas into high gear. It supplied no hydrologic definition, since the administrative rules had already done that. What it supplied was consequence: federal financing and community obligation attached to whatever the definition produced.
The chain runs through several institutions at once. FEMA maps the hazard area using historical flood data, storm-surge models, topography, and engineering analysis. The resulting Flood Insurance Rate Map assigns every parcel a zone. Inside the hazard area with a federally regulated mortgage, your lender generally cannot close the loan without a flood policy. Your local government must hold new construction to minimum elevation and floodproofing standards: lowest floor at or above the Base Flood Elevation in most zones, bottom of the lowest structural member at or above it for buildings on pilings in coastal high-hazard areas. Outside the line, federal law requires nothing, though a lender may still ask.
What the gauges show
The whole system rests on an assumption hydrologists call stationarity. The statistical distribution of flood events doesn't shift over time; the record you used to calculate the probability stays representative; the past tells you about the future.
That assumption has been failing in ways you can locate on a map.
Dangendorf et al., published in Nature Climate Change in 2026, used tide-gauge records and climate-model experiments to estimate how the frequency of extreme coastal water levels has changed since 1900. The global median increase was about twelvefold: the 1900 hundred-year event arriving roughly every eight years by 2005. Around a fourfold increase was attributable to human forcing alone, with natural variability and other factors accounting for the remainder.
Gauge by gauge, the numbers scatter badly. Anyone telling you a single story about coastal flood risk hasn't looked at the station data.
| Gauge location | Fold increase in frequency (1900–2005) |
|---|---|
| Mayport, FL | ~50× |
| Fort Pulaski, GA | ~17× |
| Charleston, SC | ~12.5× |
| Galveston, TX | ~2.6× |
| Pensacola, FL | ~1× (essentially no change) |
One distinction has to be kept straight here, because the two quantities share vocabulary and measure different things. The Dangendorf result describes the extreme sea level at a single tide gauge that carried a 1% annual probability in 1900. Charleston's FEMA Base Flood Elevation is a regulatory water surface that varies from parcel to parcel, built out of storm-surge modeling, wave analysis, topography, and mapping convention. The finding does not mean Charleston has experienced twelve base floods. It means the probability distribution the label was constructed from no longer matches what the ocean is doing at the gauge.
NOAA's projections run the trajectory forward. These figures describe change in mean water level, the platform every storm surge and king tide and heavy rain event now stands on. Lift the platform and the same storm delivers a higher flood without becoming a worse storm.
| Scenario | Charleston rise by 2050 | Charleston rise by 2100 |
|---|---|---|
| Intermediate | ~1.3 ft | ~3.9 ft |
| High | ~1.7 ft | ~6.9 ft |
The mapping lag on top of it
Set the stationarity problem aside for a moment. The maps have their own delay built in.
FEMA doesn't update on a fixed cycle. Federal law requires the agency to assess every five years whether mapped areas need revision, which is not the same as requiring a new map for every community every five years. The GAO found that only 34% of mapped stream and coastal miles met FEMA's own standard for current, valid, or updated engineering. About 60% needed updating or were under study. A new map took roughly seven years to produce.
Charleston's maps are on the current end of that distribution, effective 2021. A recent effective date doesn't mean every underlying analysis is recent. A Flood Insurance Study is a compilation, drawing on storm models, topographic surveys, and hydrologic work of varying vintages. The date on the cover records when the package was adopted, not when the inputs were collected.
GAO's broader conclusion was that FEMA's maps generally did not reflect the best available climate science. As of September 2020, likely future conditions had been incorporated into less than 1% of mapped stream and coastal miles. The Biggert-Waters Act of 2012 had directed FEMA to use the best available science on future sea-level rise, precipitation, and hurricane intensity when revising maps. FEMA has mostly pursued that through separate, nonregulatory products rather than through the boundary itself.
I wrote in an earlier piece here about rain gauges, and how a unit of measurement can do institutional work while failing to describe the mechanism the receiving system actually experiences. A gauge reports depth per year. Soil accepts water at a rate per hour. The annual total can hold steady while the delivery pattern changes enough to drown the drainage the number was supposed to characterize. The flood map has a version of this. It reports a historical probability and presents it as a boundary, and the boundary goes on performing regulatory work — mandates, codes, lending requirements — while the probability underneath it drifts.
Risk Rating 2.0 and its limits
FEMA's Risk Rating 2.0, phased in for new policies starting October 2021, closes part of the gap between the zone label and what a property is actually exposed to. Premiums used to depend heavily on your zone, your elevation relative to Base Flood Elevation, and whether the building predated the first map. Now they're calculated from property-specific modeled risk: flood type and frequency, distance to water, ground and first-floor elevation, building characteristics, replacement cost, prior claims. A coastal house in Zone X sitting just outside the hazard boundary can now be priced high even though nothing requires it to carry a policy at all.
The pricing got more accurate. The line didn't move. The hazard-area boundary still determines whether federal law mandates coverage on a federally backed mortgage, and it still triggers the local construction requirements. A homeowner outside the boundary can get a premium that reflects real exposure, which is worth something, but they aren't required to buy it and their municipality isn't required to regulate how they build.
GAO estimated in 2023 that 95% of existing policyholders won't reach their full-risk premiums until around 2037, because statute caps how fast the increases can arrive.
For anyone buying, insuring, or renovating, the zone answers a regulatory question and only that one: does federal law require insurance here, and do floodplain construction standards apply? It says nothing about how often water reaches your elevation or whether that interval is shortening. A property outside the hazard area can carry substantial flood risk the zone doesn't flag and the law doesn't require anyone to insure. Risk Rating 2.0 might price that risk correctly, but without the mandatory-purchase trigger most owners never find out what the number would have been. Gauge records, local flood history, and ground elevation measured against current tidal and storm conditions will tell you things about a specific address that the zone category was never built to convey.
What replacement would require
A few jurisdictions have started designing forward instead of backward. New Jersey's Inland Flood Protection Rule, effective July 2023, requires certain inland development permits to calculate flood elevations using projected rather than historical precipitation, plus two feet of freeboard. The Army Corps requires coastal planning studies to consider a range of future sea-level scenarios. NOAA has been building Atlas 15, which replaces stationary precipitation-frequency assumptions with nonstationary methods running climate projections out to 2100; preliminary estimates for the contiguous U.S. were scheduled for September 2026.
Those are project design standards, a state permitting rule, and a scientific dataset. None of them touches the national boundary that decides who must carry insurance and who must build to flood standards. The Federal Flood Risk Management Standard, which had required federally funded projects to build to higher elevations or an expanded floodplain to account for future conditions, was suspended in March 2025. FEMA's August 2026 regulatory plan indicates the agency intends to strip the remaining provisions out of its regulations by fall.
Replacing the national hazard area would mean answering questions the 1968 group got to leave alone. What probability should govern a national program? Should it vary by region, by coast, by observed rate of change? Who absorbs the cost when a redrawn line puts more properties inside the mandatory zone: the homeowner, the insurer, the lender, the city? And how do you map a threshold that is itself moving, when the return period at Charleston's gauge went from a century to eight years inside a century and has not stopped shortening?
These are political questions with technical vocabulary. The 1% standard was chosen because it could be administered, and it has survived for the reason infrastructure standards generally survive: the cost of changing it is never as urgent as the next emergency, and the calm stretch you'd need to do the work never arrives. The NFIP already owes the Treasury more than $20 billion. Moving the line would change the value of millions of properties, the obligations of thousands of communities, and the books of a program that can't currently pay for itself. Redraw it and you don't just describe a new risk, you create a new set of people who have to buy something.
Meanwhile the permits keep coming across the desk. Someone in Charleston wants to redo a kitchen and a roof, and Schnell's staff runs the cost against the assessed value to see whether it crosses fifty percent. If it does, the building has to come up to the elevation requirement, which is calculated from a probability distribution that the gauge data says stopped describing the ocean some time ago. The determination gets made, the certificate gets filed, and the next application is already in the queue.
- Flood timing is shifting: A May 2026 global modeling study estimated that peak-flood timing advances by about 0.43 days for every additional 0.5°C of warming, with regional shifts moving in opposite directions — a moved flood season can collide with planting, reservoir operations, or maintenance windows even when the conversation stays focused on flood depth.
- NOAA's new precipitation atlas: NOAA Atlas 15, designed to replace the stationary assumptions behind current precipitation-frequency estimates with nonstationary methods incorporating climate projections through 2100, is expected to release preliminary contiguous-U.S. estimates in September 2026 — data that could eventually reshape the engineering inputs feeding FEMA's flood maps.
- Groundwater adaptation transfers risk: A 2026 California study found that heat and surface-water scarcity increased agricultural well construction, groundwater depletion, and domestic-well failures falling disproportionately on low-income and Latino communities — a pattern where one user's drought adaptation becomes another's water emergency.
- The "100-year" label at other gauges: Dangendorf et al.'s site-level supplement shows the historical 100-year coastal extreme shifting to a two-year return period at Mayport, Florida, but barely changing at Pensacola, a variation wide enough to make any single national narrative about coastal flood-frequency change misleading.