The Hundred-Year Label
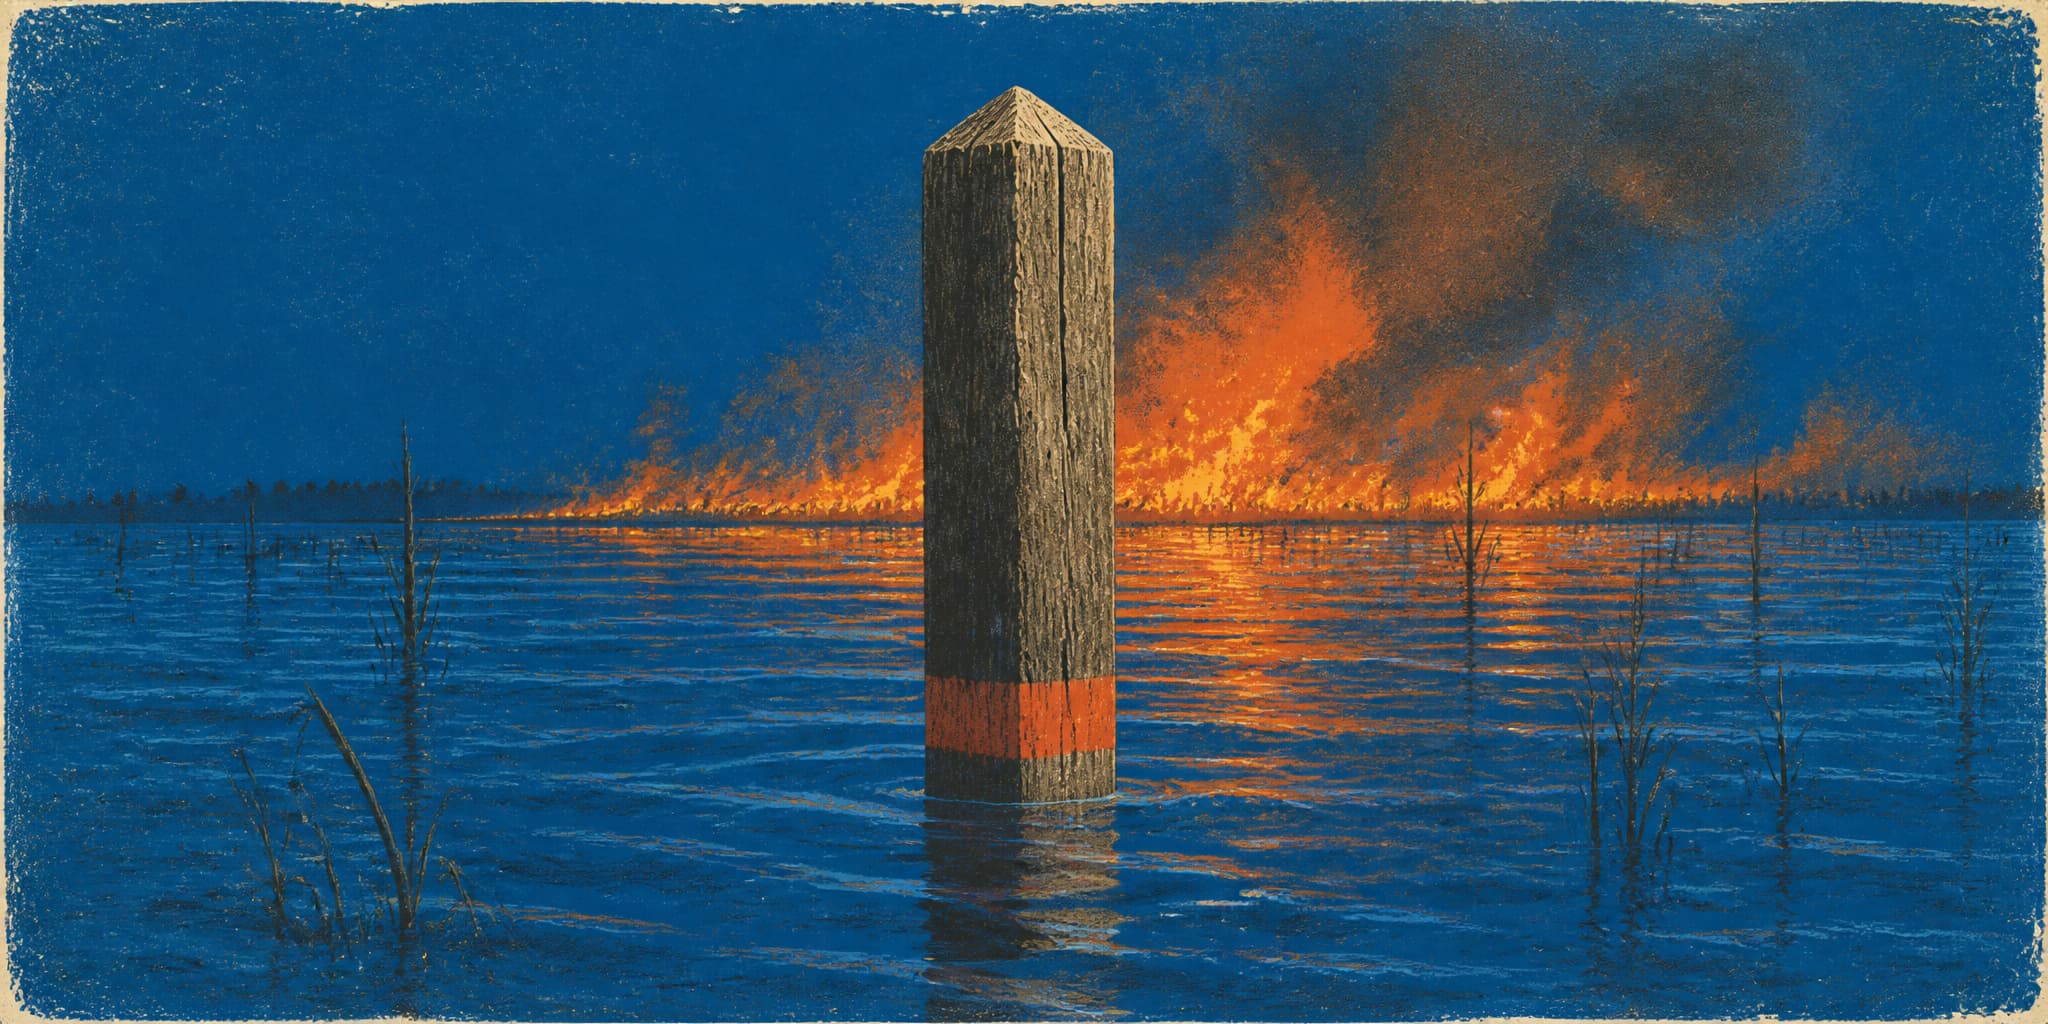
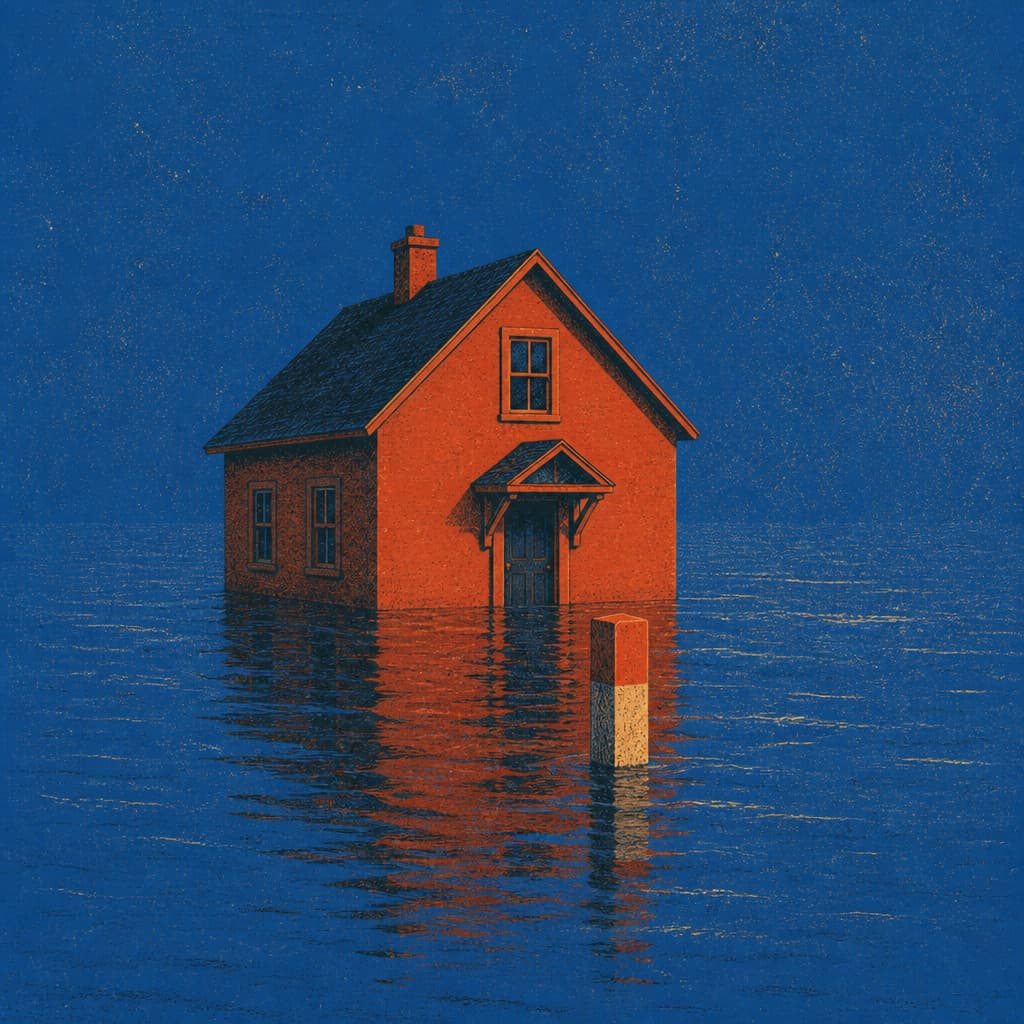
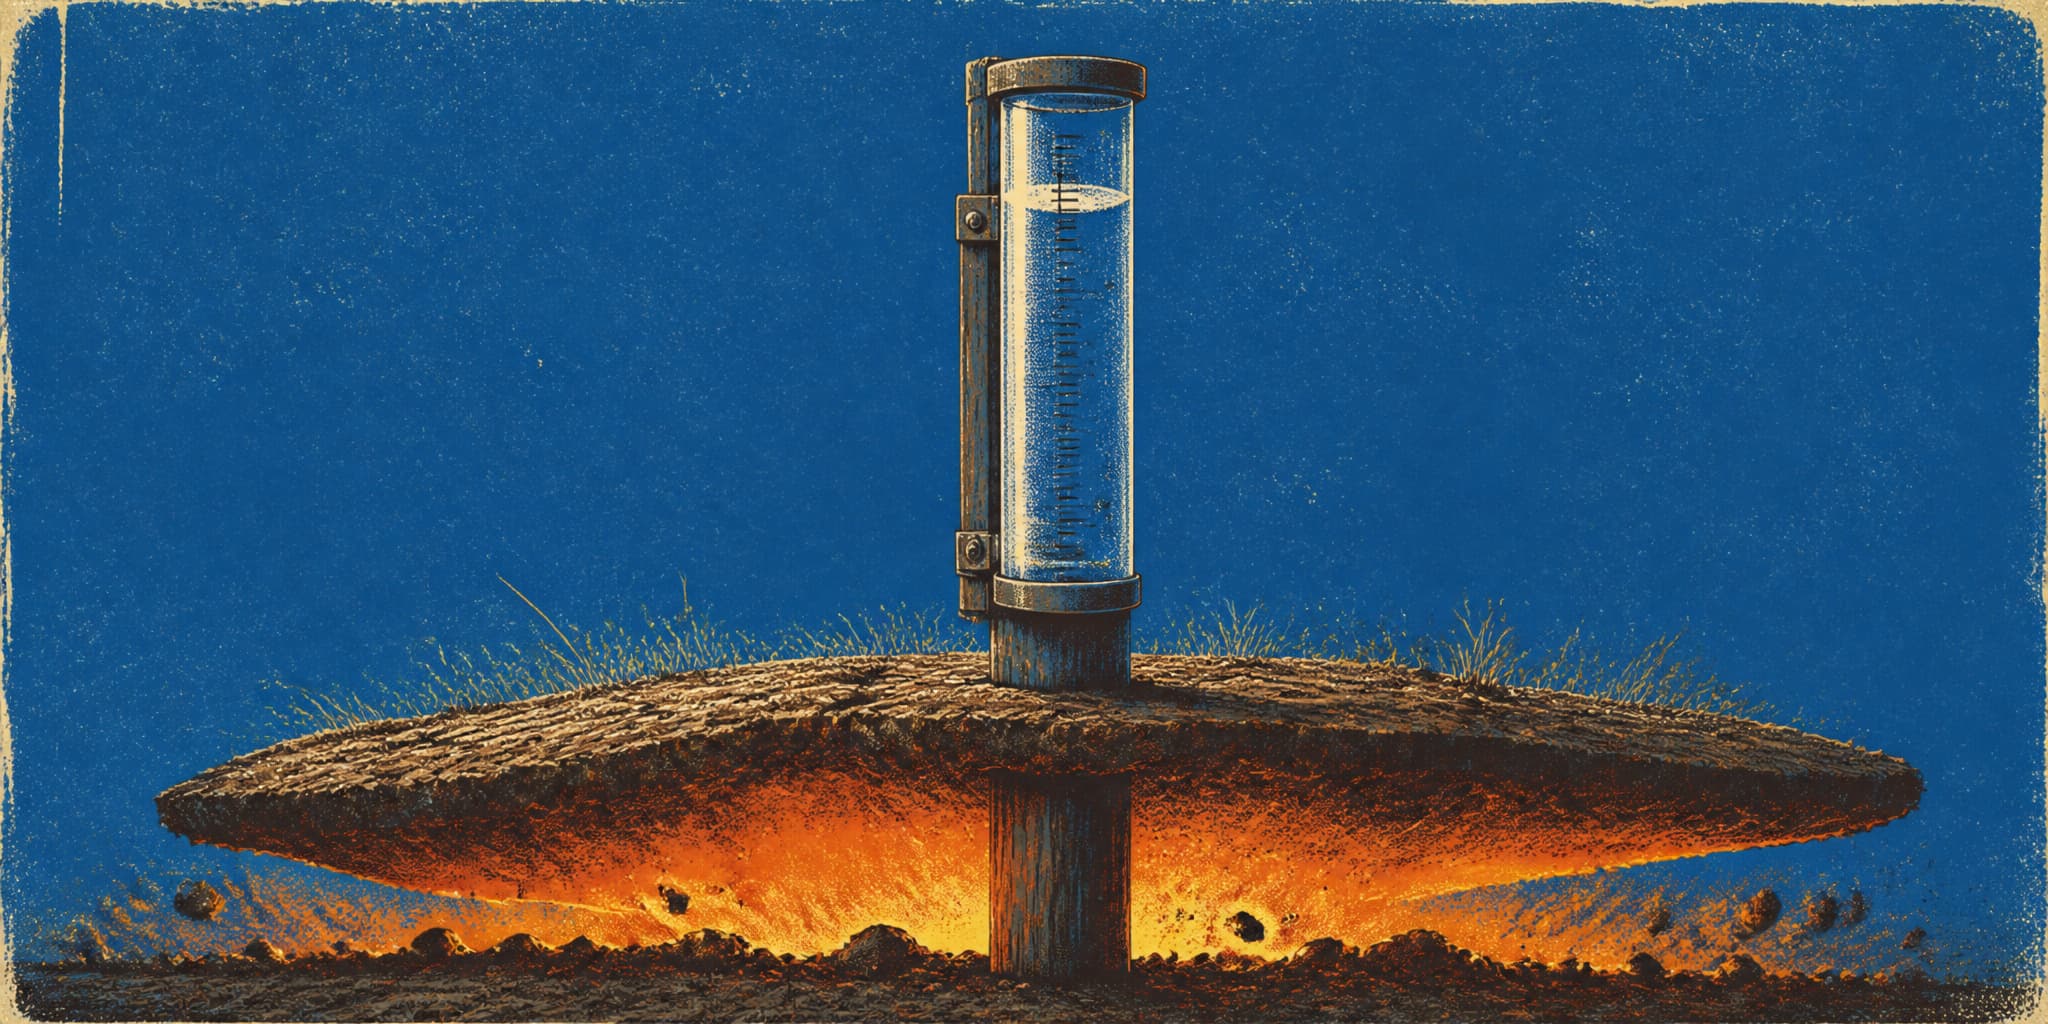
In December 1968, about fifty specialists spent roughly a day and a half choosing the statistical threshold that would decide where Americans need flood insurance, where builders must elevate structures, and where lenders can close a mortgage. They settled on a 1% annual chance of flooding, the "100-year flood." It was a compromise made under a deadline, adopted because the alternative on the table was no standard at all. It became federal regulation by 1971 and mortgage law by 1973. At Charleston's tide gauge, the water level carrying that probability in 1900 was arriving roughly every eight years by 2005.
The Hundred-Year Label
In December 1968, about fifty specialists spent roughly a day and a half choosing the statistical threshold that would decide where Americans need flood insurance, where builders must elevate structures, and where lenders can close a mortgage. They settled on a 1% annual chance of flooding, the "100-year flood." It was a compromise made under a deadline, adopted because the alternative on the table was no standard at all. It became federal regulation by 1971 and mortgage law by 1973. At Charleston's tide gauge, the water level carrying that probability in 1900 was arriving roughly every eight years by 2005.
The Research Record
Human-driven sea-level rise has quadrupled the frequency of coastal sea-level extremes since 1900
A global median across tide gauges, not a forecast for your coastline, your property, or your flood zone.
CMIP5 simulations end at 2005, leaving twenty years of accelerating emissions and sea-level rise unaccounted for.
The Research Record
NOAA Annual High Tide Flooding Outlook, 2026–2027
Last year only 42% of stations fell within the predicted range. Pacific stations far exceeded projections; Gulf stations fell well short.
Mid-Atlantic stations may see up to 27 flood days, with over 75% predicted to set or match records.
The Shape of Disagreement
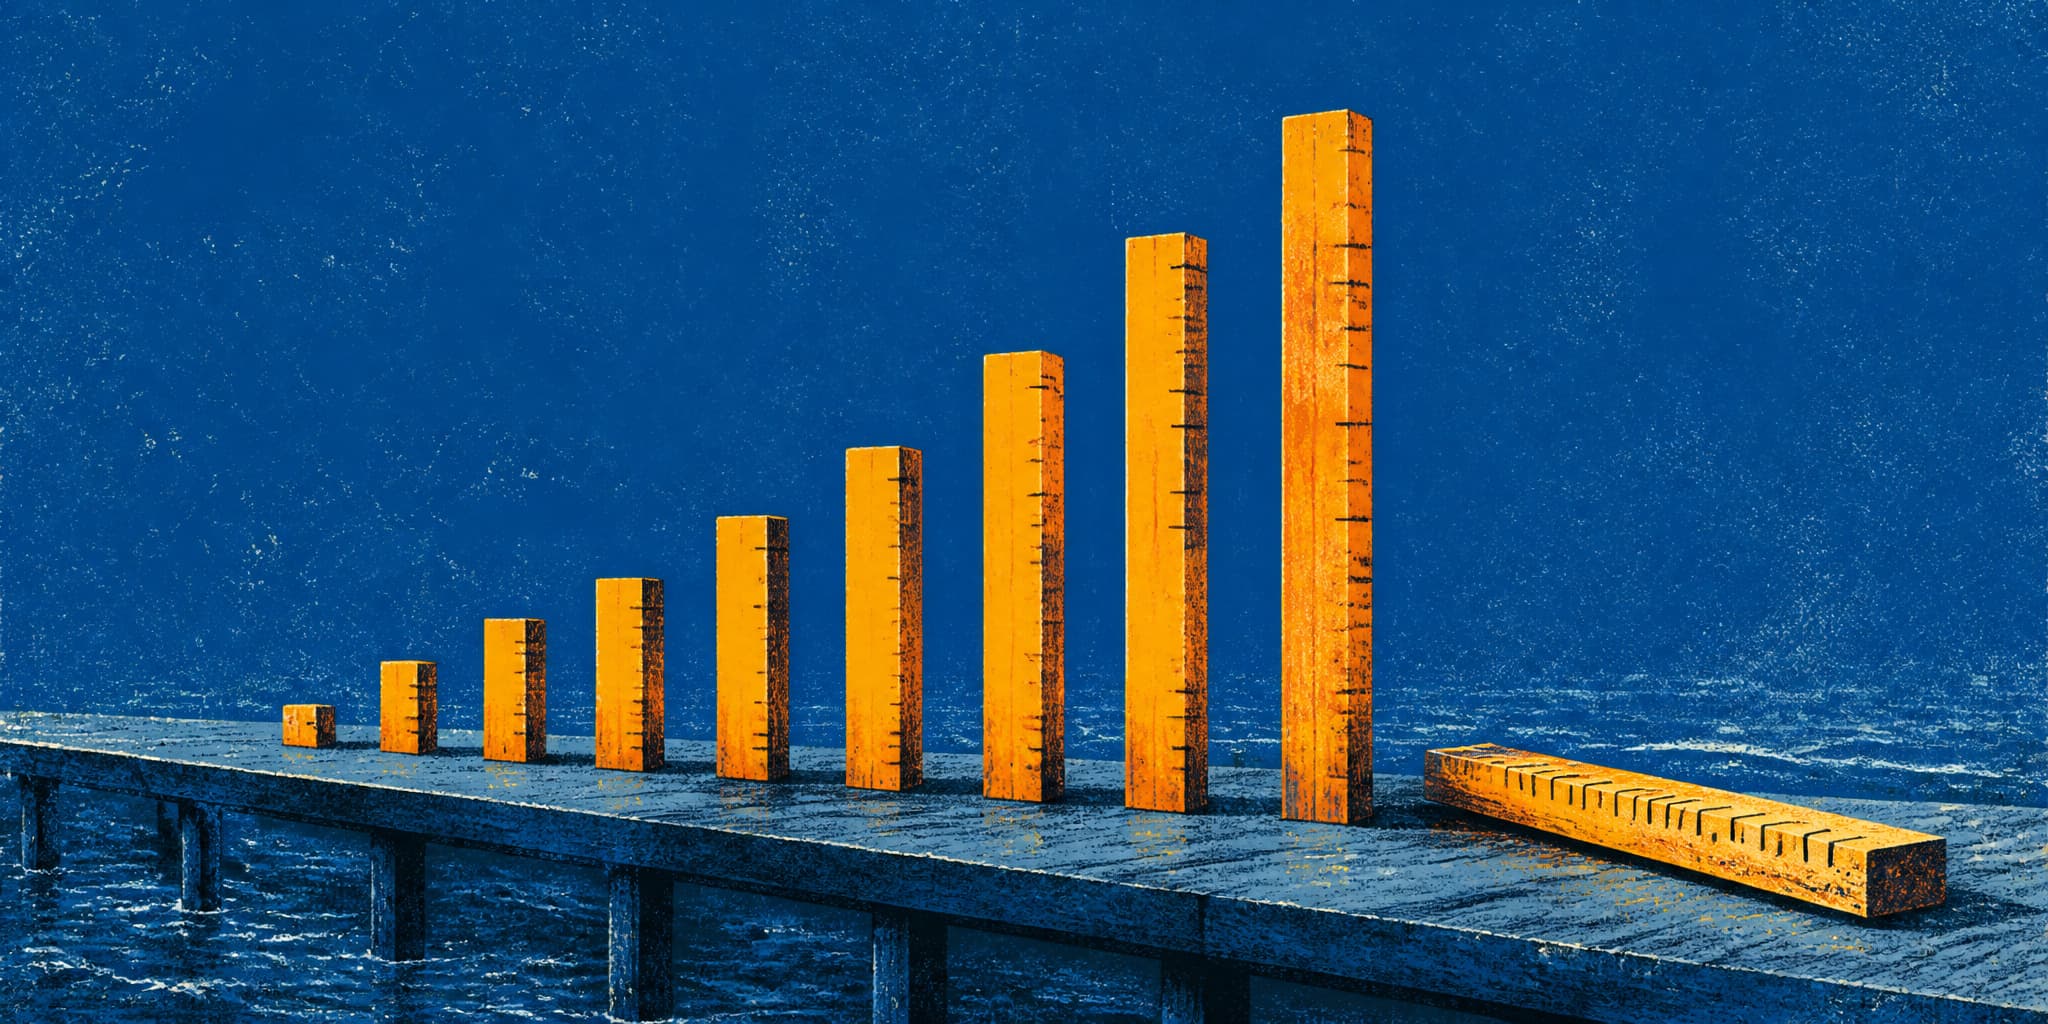
Two papers this summer examined the Atlantic Meridional Overturning Circulation, the ocean conveyor that carries warm water north and keeps East Coast sea levels in check. Both agree it's weakening. The disagreement is about what shape the danger takes. Van Westen et al. found that AMOC stability depends on how fast the planet warms, not how much — the same temperature produced collapse or survival depending on the rate. Mehling et al. found Greenland meltwater weakens the AMOC substantially but doesn't trigger abrupt shutdown in their model.
The prior estimate for an AMOC collapse threshold was roughly 4°C, with uncertainty so wide it was barely useful. These papers don't narrow that range. They call into question whether a fixed threshold is the right way to think about the problem at all. If rate matters as much as magnitude, the number moves depending on how fast you approach it — which means coastal planners from Boston to Miami are working with a target that won't hold still.