
The Week Heat Became Visible — Chicago, July 1995

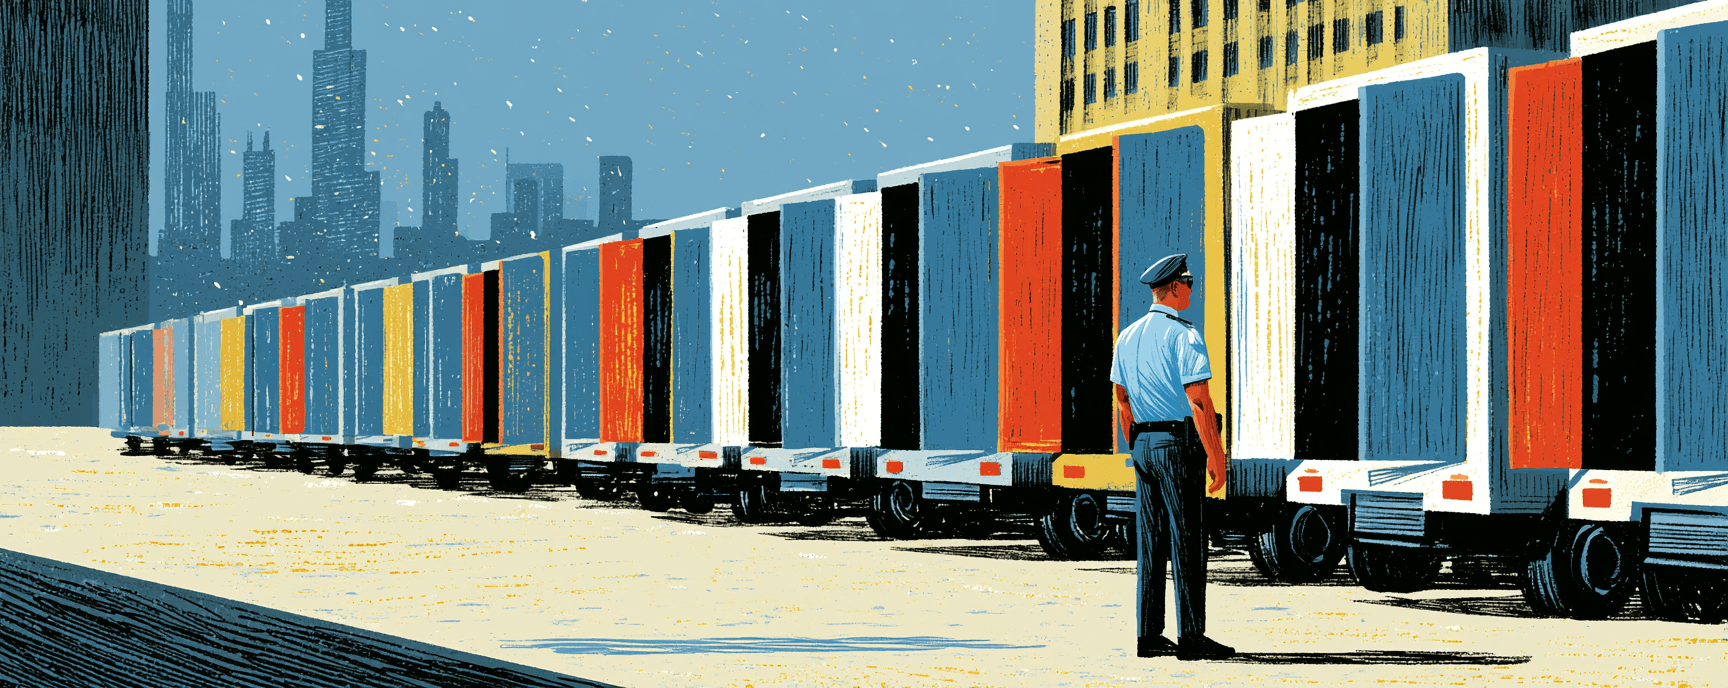
The Cook County Medical Examiner's office could hold 222 bodies. In a normal week, that capacity was invisible because it was adequate. When Chicago's heat index hit 119°F in July 1995, people died alone in apartments faster than any recording system could count them. Refrigerated trucks parked outside the morgue to hold the dead. The Tribune printed numbers that City Hall wasn't ready to acknowledge. In the brief window before the city moved on, Chicago built new institutional machinery, each component a precise admission of what had failed.
The Week Heat Became Visible — Chicago, July 1995
The Cook County Medical Examiner's office could hold 222 bodies. In a normal week, that capacity was invisible because it was adequate. When Chicago's heat index hit 119°F in July 1995, people died alone in apartments faster than any recording system could count them. Refrigerated trucks parked outside the morgue to hold the dead. The Tribune printed numbers that City Hall wasn't ready to acknowledge. In the brief window before the city moved on, Chicago built new institutional machinery, each component a precise admission of what had failed.
The Counting Problem

During the most intense days of Chicago's July 1995 heat wave, the Cook County Medical Examiner certified 485 deaths as heat-related. A statistical comparison of that same week against normal mortality patterns found 739 excess deaths. Those two numbers measure different things. The ME determines whether heat killed a specific person. The statistician asks whether that person would have died that week without the heat. Roughly 254 people fell into the space between those questions. Their death certificates recorded the final mechanism, a cardiac arrest or respiratory failure, rather than the 106-degree afternoon that accelerated it. The CDC acknowledged the problem plainly: deaths where heat was a contributory cause "may not be recorded as heat-related." A standard definition was promised. Criteria were published in 1997. Adoption remained voluntary. Three decades later, every official heat-death toll still functions as a minimum estimate, and the gap between that floor and the real number determines how seriously any city treats the next July.

Pattern and Test

The Map That Wasn't About Poverty
Chicago's 1995 heat wave killed 739 people, and the deaths fell where most observers expected: poor neighborhoods, Black neighborhoods. But sociologist Eric Klinenberg found something the poverty map couldn't explain. Adjacent South Side communities with nearly identical demographics produced wildly different body counts. The determining factor turned out to be whether anyone would notice you hadn't opened your blinds.

What the Plan Could and Couldn't Prove
After 1995, Chicago built an emergency heat plan. When temperatures surged again in 1999, the city deployed cooling centers, wellness checks, free buses. Deaths dropped dramatically. Officials called it proof. But 1999 was also cooler, media coverage was faster, and residents who remembered burying neighbors took precautions on their own. The city tried to manufacture through municipal labor what functioning neighborhoods once provided automatically. Whether it worked is harder to answer than it looks.
Further Reading