

A new USGS study in the Journal of Hydrology compared two ways of tracking groundwater drought: 1,510 monitoring wells in the ground, and a satellite product that weighs water from orbit. At individual locations, the two barely agree. Very low correlation, the authors write.
They're looking at different water. The satellite reads a patch about seven miles across and mostly senses moisture near the surface. A well is a six-inch pipe drawing from one layer at one depth, sometimes a deep one sealed off from the rain above by clay and rock.
Which is how a county map can say moderate drought over a kitchen where the water has been falling for six years. It runs the other direction too.
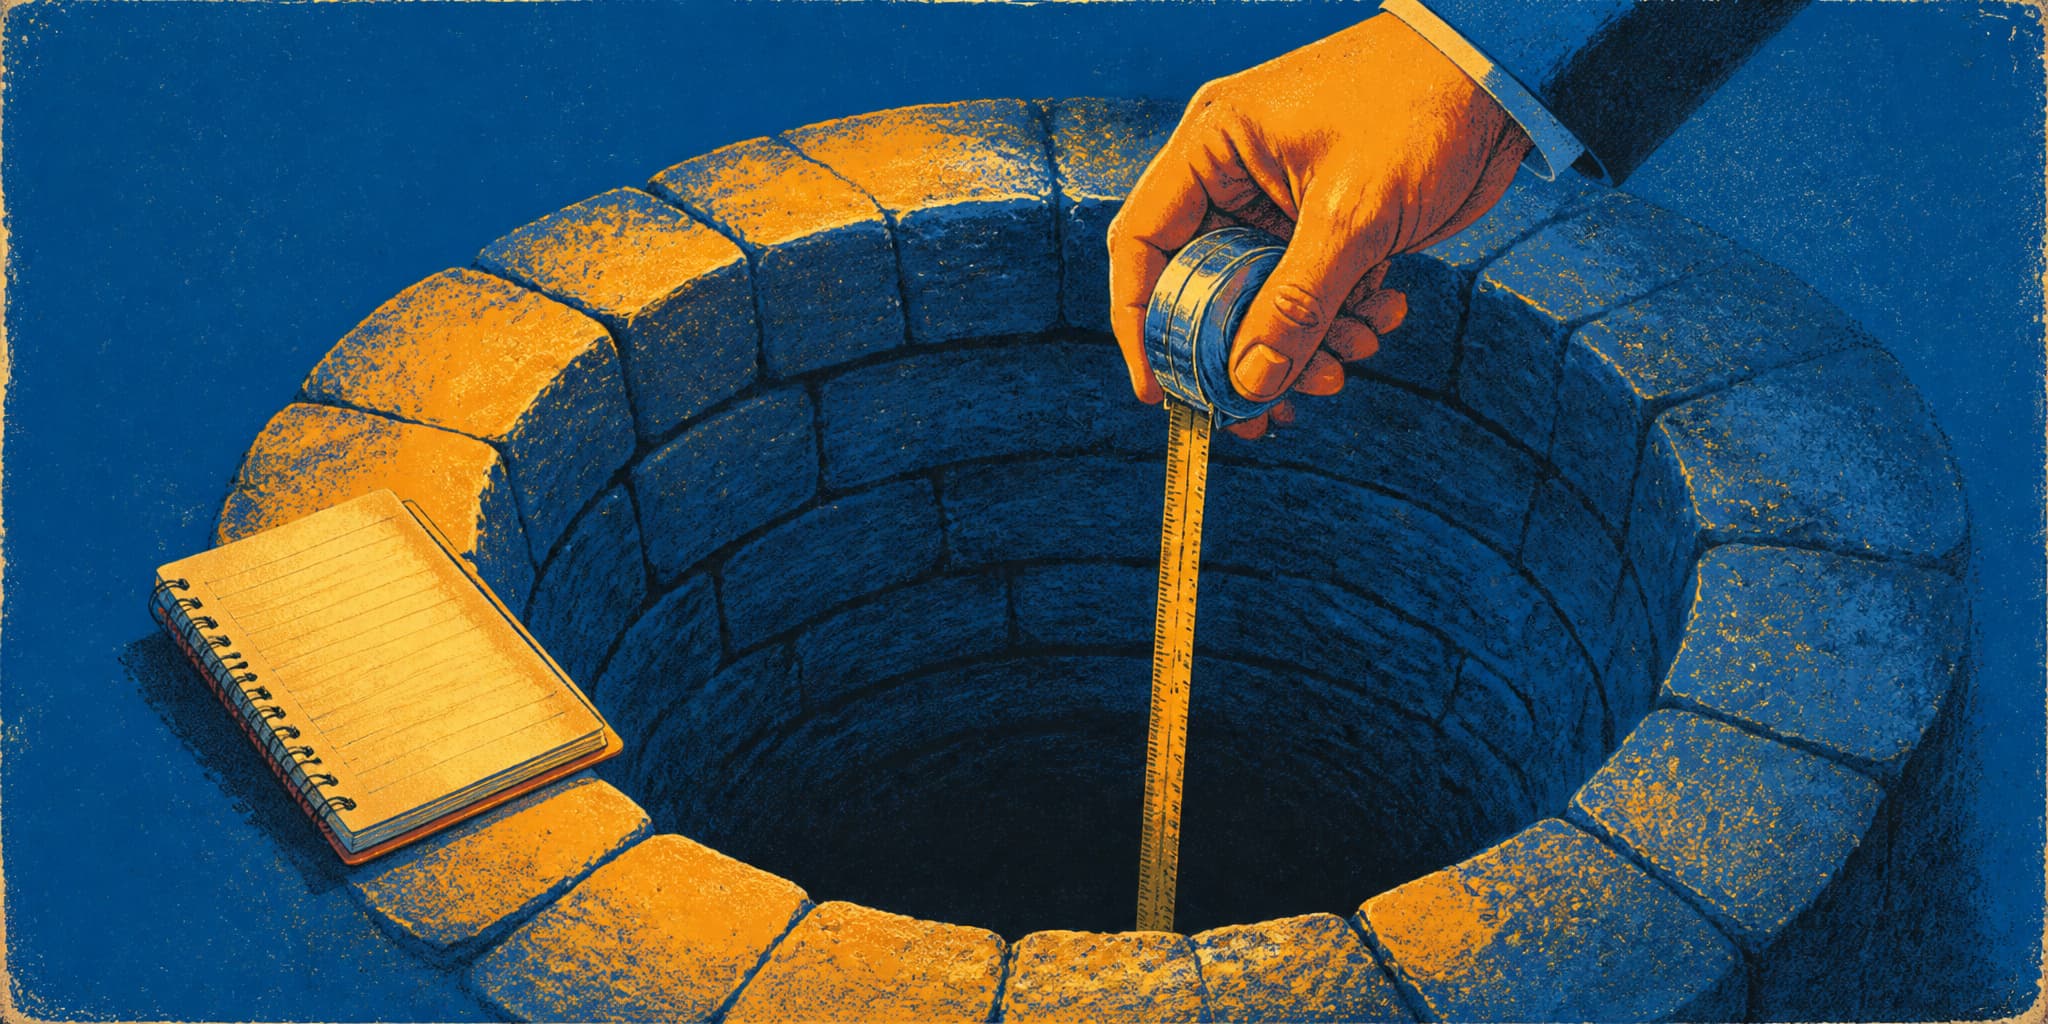
For the 43 million Americans on private wells, nobody regulates that water and no agency logs the level for you. The county map is context; the number that matters is the one someone writes down at the wellhead, a depth and a date, twice a year.
Thinnest coverage where it's worst: The Southwest had the longest, most severe groundwater droughts of any region from 2001–2020 and the fewest monitoring wells. The study's own recommendation: more wells, particularly in the West.
Not evenly bad: The Southeast showed widespread increases in drought duration and severity plus falling water levels. The Northeast, over 1981–2020, showed many significant decreases.
Recovery isn't symmetric: Shallow wells suffer first when rain stops, and rebound fastest. Deeper wells hold on longer, then take far longer to come back.
Four questions worth answering before the next dry summer: How deep is my well? Which layer does it draw from? Where does the water sit today? How does that compare to this month last year?
Signs before a well quits: Sputtering taps, cloudy water, odd smells. (Penn State Extension)