

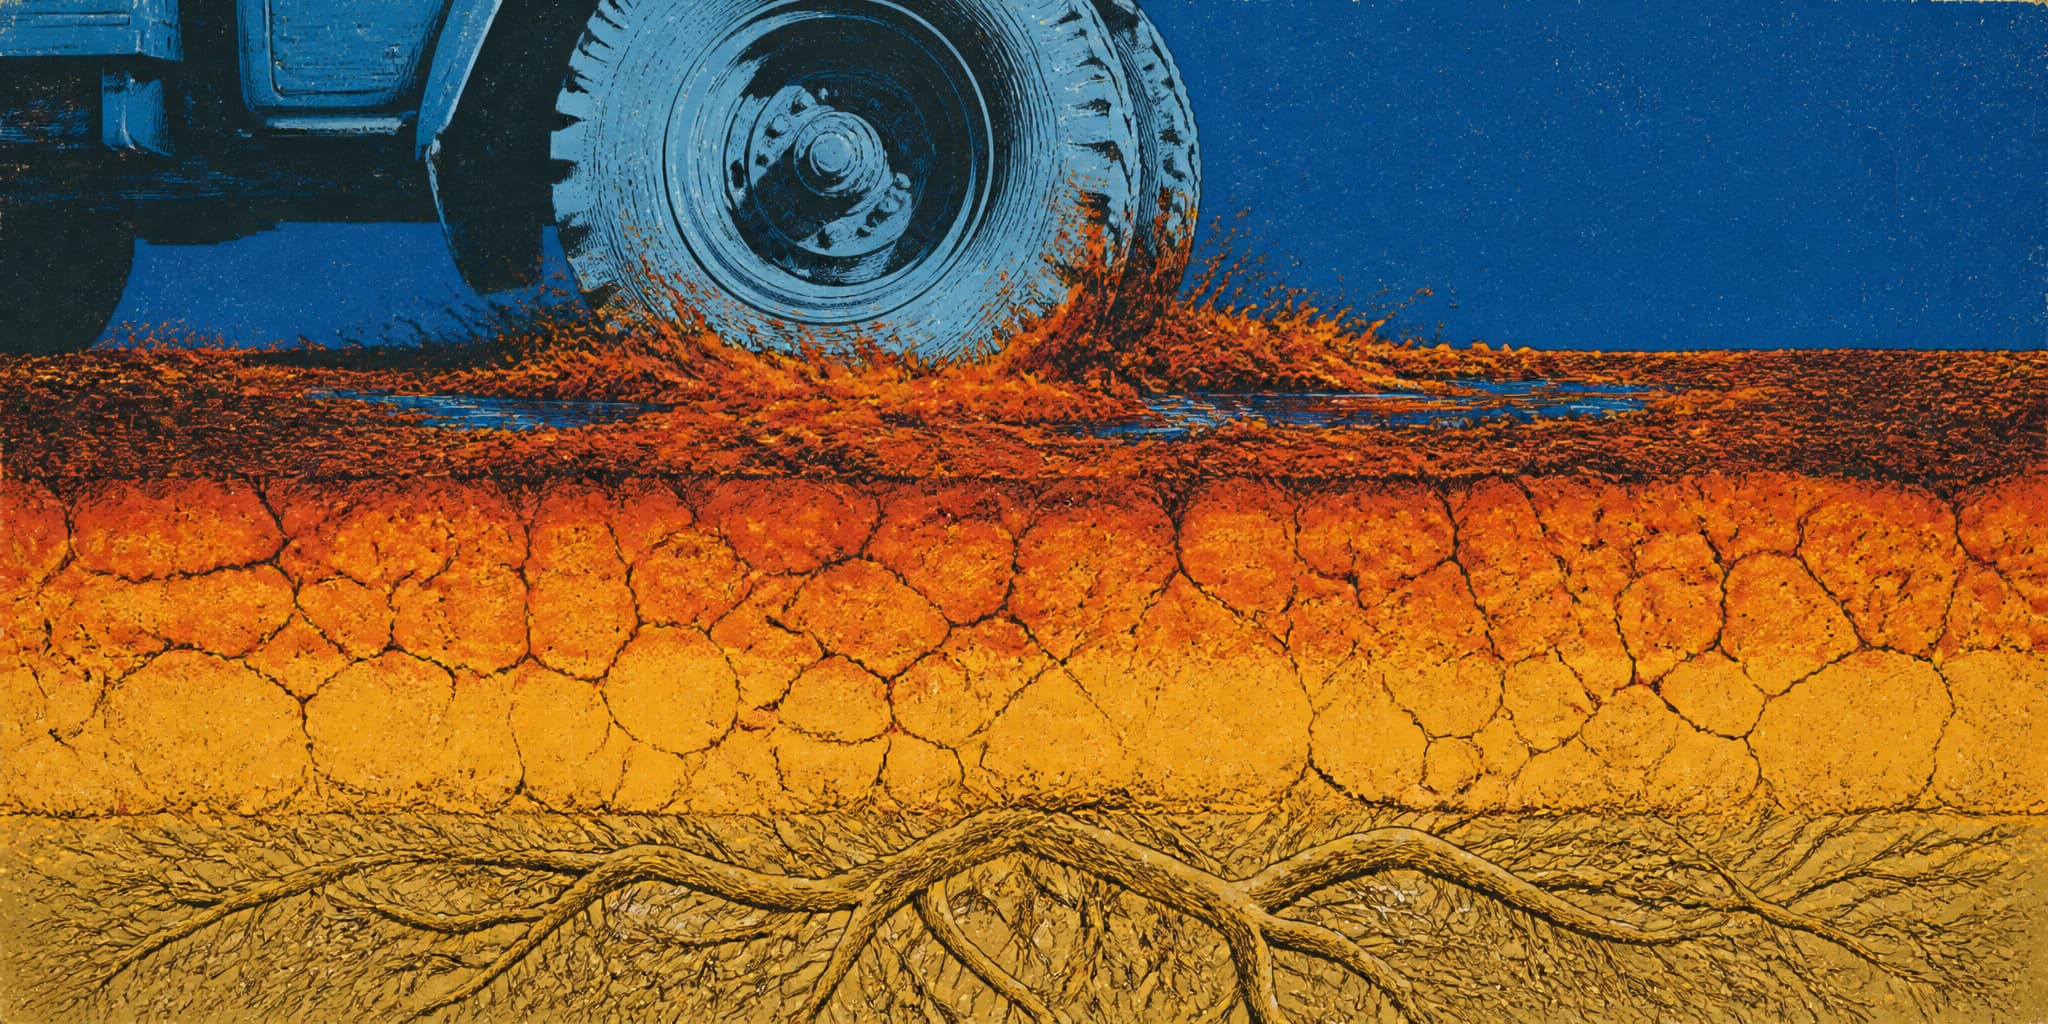
In the last week of July 2026, the first monsoon rain of the season turned a low spot in the road near Norwood, Colorado, to mud. Mark Ragsdale drove his Dodge Ram through it on the way to haul water to 45 cow-calf pairs. He was making the run morning, afternoon, and evening, which for a rancher who also has fencing and feed and everything else that keeps livestock alive through summer means the water haul has stopped being a chore and become the operation. His solar well was still producing. Neighbors were calling to ask where they could find water.
Ragsdale is also a Colorado state water commissioner for the Norwood area. The same man hauling to his own stock tanks administers water rights across the region. He is not alone in the squeeze: Scott Snyder, running about 800 pairs near Montrose, told the AP his family was making eight trips in three vehicles over nine hours to move enough water for maybe two days, and that was after culling the herd and buying hay.
Six days after the mud, a National Weather Service hydrologist in Grand Junction, Erin Walter, described what the instruments were reading across the same country. Parts of southwest Colorado had upper soil near saturation. At roughly a meter down, estimated moisture was still below normal. Stream gauges sat below average or near record lows. Walter pointed out that the region's reservoirs live on winter snowpack and spring runoff, not on summer thunderstorms.
Mud on the road and a dry well half a mile away are both accurate. They are readings taken at different depths in the same week.
A column of soil is not a single number
Drought monitoring works, for practical purposes, like this: dozens of indicators get synthesized into a weekly map, the U.S. Drought Monitor, and that map drives water allocations, stocking decisions, and federal disaster declarations. Its rotating authors weigh precipitation, soil moisture products, streamflow, reservoirs, snowpack, vegetation indices, and input from local experts. Arizona's drought monitoring committee has said plainly that the relevance of any given indicator shifts with the season and the type of drought. There is no published national formula setting how surface moisture gets weighted against root-zone moisture.
The harder problem sits upstream of the map, in what the observations can physically see.
NASA's SMAP satellite is the most widely used soil moisture dataset in the country, and it directly measures the top five centimeters. Two inches. Its root-zone product carries the label 0–100 centimeters, which sounds like it covers the whole rooting depth, but it isn't a measurement at all. It's the shallow reading fed into a land-surface model that estimates what the deeper layers are probably doing, averaged across a nine-kilometer grid cell. Inside nine kilometers you can have three soil textures, a caliche hardpan on one bench and not the next, north- and south-facing slopes, a monsoon cell that dumped on one pasture and missed the one beside it, and grazed and ungrazed ground with different infiltration behavior. The model averages all of that into one number.
The USDA's SCAN network does the job properly. Its stations sit in the ground and measure at five depths from roughly 5 to 102 centimeters. Across Arizona, New Mexico, Colorado, Texas, and Utah combined, there are 60 active stations. Both of Colorado's are in Weld County, up in the northeastern corner, some 350 miles from Norwood. Southwest Colorado, where Walter had just described saturated surface sitting over a depleted meter, has none.
So the satellite sees two inches and infers the rest; the station network can resolve a full profile but isn't standing anywhere near the place the disconnect was documented. The Drought Monitor works with what exists, and what exists is better at the top.
A 2024 analysis of 2,405 soil-moisture time series from 637 U.S. stations found that the drought timescale a sensor responds to lengthens from roughly 10 days to 80 days as you move from 2 inches down to 36. Shallow soil is reacting to last week. Deep soil is integrating last season.
The layer the monitoring system measures best is also the layer that changes fastest and recovers first.
When every layer dries at once
A study published this month in Nature Geoscience by Gu and colleagues gives the vertical structure a name and a global accounting. They call it vertically compound drought: surface, middle, and deep portions of the upper meter of soil all depleted at once. Their analysis runs from 1981 to 2020. The events have grown more frequent or longer-lasting across more than half of global land area, and southwestern North America is one of the hotspots.
The number that matters for anyone trying to decide whether a drought is over: when the researchers collapsed moisture into a full-profile average, the way most monitoring products summarize conditions, that average overstated the duration of true all-layer drought by 128 percent, and understated productivity loss during those events by nearly 28 percent.
The error runs in a particular direction. On the days when the whole-profile average said drought but the individual layers disagreed, about 68 percent of the time the surface was moist while the middle or deep layer was still dry. The average was being pulled into drought range by what was happening at depth while the top had already come back. So the summary reads drought, and the ground reads green, and both are telling the truth about the layer they're describing.
That is roughly the condition Ragsdale was standing in. The monsoon came down hard and localized, wet the top, and ran off. The road was mud. The pasture may well have greened. The meter of soil that perennial grass roots depend on, and that eventually feeds the water table, had not received the delivery.
How long the deeper layers take
There is no validated rule for how long 50–100 centimeter soil moisture in Southwestern pasture takes to come back after a multiyear drought. The literature offers several clocks and they don't agree, which is not a sign that the science is unsettled so much as a sign that each study is watching a different depth, a different vegetation type, a different threshold for "recovered," and a different severity of starting deficit. You can't convert one into another for the same reason you can't convert a creek gauge into a well log. They're reading different parts of the same system at different speeds.
Modeled droughts at 10 and 30 centimeters in the Southwest, shallow enough to feel a season, ran 60 to 270 days in most cases. Events longer than that were uncommon and generally required below-average moisture through one or more consecutive rainy seasons. Go deeper and wider and the clock stretches. An analysis of western U.S. drought recovery using a basin-scale index that combines precipitation with evaporative demand, rather than measuring soil at a fixed depth, found severe drought took about a year to recover under early-twentieth-century climate and 13 to 16 months under current conditions, with the slowdown concentrated in the Colorado basin and other warming regions.
On the Colorado Plateau during the current megadrought, the picture gets bleaker. Researchers logged only two recharge events at 30–50 centimeters across their entire experimental period, and that was in plots left fully open to precipitation. At that depth, in that soil, water arrived episodically and did not accumulate.
A different question, asked in a northern Arizona ponderosa forest: a five-year monitoring study with 126 sensors at 25, 50, and 100 centimeters found the deepest layer started drying about 17 days later each spring than the shallowest. The heavy snow year of 2023 did not reduce the time the trees spent under physiological drought stress, because the monsoon arrived unusually late. Starting moisture and the timing of the next recharge jointly set the stress level, even in a wet year.
The spread across these studies is itself worth reading. Soil texture sets how fast water moves down a profile, and vegetation determines how much gets pulled back out before it arrives. Antecedent moisture decides whether new rain fills pore space or just wets the walls of it; storm intensity, whether it infiltrates or sheets off. Season sets the evaporative demand pulling against all of it. Nothing in that list holds still from one site to the next, and none of it averages into a regional countdown a rancher or a forest manager could actually use.
What the evidence does support is seasonal: shallow conditions can flip with a single monsoon cell, while deeper recharge may wait on a sufficiently wet season, a run of them, or on winter precipitation arriving when evaporative demand is low. Ragsdale's own estimate — "It's gonna take 10 years of above-normal precipitation to get back to what I consider normal" — is a producer's read on accumulated regional deficit. The science can neither confirm nor refute the number. It can confirm that the timescale he's working on is closer to the deep-soil reality than anything on the weekly map.
I wrote about a related problem in an earlier piece for this publication: annual rainfall totals that look adequate on paper while the rain itself arrives in fewer, heavier events, faster than the soil can take it in. Same disconnect, one layer up.
The trees keep the deeper record
Arizona's 2022 monsoon was the ninth-wettest on record for the state. Short-term drought indicators improved. D3 conditions came off the state map by the end of the water year.
In that same year, the Forest Service's aerial survey mapped pinyon mortality across roughly 356,000 acres in Arizona and New Mexico, up from 136,000 the year before. The cause was listed as drought stress compounded by bark beetles and twig beetles, insects that move into trees already weakened by years of insufficient water at rooting depth. The heaviest concentrations were on the Kaibab National Forest, Navajo Nation lands, and the Cibola.
Ponderosa mortality dropped that year, to about 310,000 acres from 543,000. The Forest Service credited adequate monsoon moisture and reduced competition after the earlier die-off. Pinyon and ponderosa in the same region, under the same monsoon, went in opposite directions. Pinyon roots shallower than ponderosa; the depth at which the moisture actually arrived decided which one was still standing.
The aerial survey carried no paired soil-profile measurements. The Fort Valley sensor study tracked no mortality. Two lines of evidence pointing at the same mechanism from different angles, never meeting at a single site. But it fits what Gu and colleagues found globally: surface improvement and continuing biological damage are observations of different depths, and the deeper one governs whether the organism drawing from it lives.
Which layer the decision depends on
As of September 1, 2026, drought covered 59.1 percent of the contiguous United States, following the warmest summer in the 132-year record. By mid-August, 94 percent of the Intermountain West sat in moderate to exceptional drought. July monsoon rain brought localized relief across Arizona, Utah, and the western edges of Colorado and New Mexico without producing meaningful improvement in regional water supply.
These conditions sit inside a longer pattern. A study published this year in Nature Climate Change by Zhang and colleagues found that across global drylands, average greenness has climbed since 1982 while year-to-year volatility has grown with it: the good years greener, the bad years worse. A separate piece here will take that research up properly. But an average trending one way while its components spread apart is the same reading problem whether you're looking at a satellite greenness index across four decades or a soil moisture profile across a meter.
For the rancher deciding when to restock, the farmer picking a planting date, the forest manager sizing up mortality risk, the water board setting allocations, the Drought Monitor's improvement after rain is real. The surface did recover. The question each of them has to answer separately is which layer their decision rests on.
Ragsdale has to answer it twice. As water commissioner, he administers rights in a system whose supply comes, as Walter noted, from winter snowpack and spring runoff. A wet monsoon week can lift the Drought Monitor classification for his region while contributing almost nothing to the reservoir storage and streamflow that determine what there is to allocate next season. He can watch the map improve and know from the same working knowledge that tells him his pasture roots are still dry that the improvement doesn't reach the system he's responsible for. The pinyon and the ponderosa are the biological version of that split. A forest manager standing under a canopy that greened up after monsoon rain, deciding whether to thin a stand or start planning beetle salvage, is placing a bet on conditions at 50 centimeters using instruments calibrated to five.
Through the week the road was mud, Ragsdale ran the water three times a day. He told the AP it would take ten years of above-normal precipitation to get back to normal as he reckons it. That figure may be off in either direction. What's not in dispute is that a man who administers water for a living could not keep his own stock tanks full in a week the map was improving, and that there is no station in his county measuring the layer that would explain why.
- Greening that masks instability: A Nature Climate Change study found that global drylands have grown greener on average since 1982 while year-to-year vegetation volatility increased across about 82% of drylands, with good-year maxima rising as poor-year minima fell.
- Drought recovery slowing down: A western U.S. analysis estimated that anthropogenic warming has added roughly 1–4 months to severe drought recovery times in the Colorado basin and other warming regions compared to early-twentieth-century conditions.
- Shallow soil drought and seasonal rain: A 2025 study of Southwestern soil moisture found that drought events at 10–30 centimeters were controlled by seasonal precipitation variability, with events exceeding 270 days generally requiring one or more consecutive failed rainy seasons.
- Forest thinning and deep moisture: Five years of hourly monitoring at 126 sensors in a northern Arizona ponderosa forest found that thinned stands retained more moisture and spent fewer days under physiological drought stress than unthinned forest, even during wet years when late monsoon onset negated snowpack gains.