The Drought Below the Surface

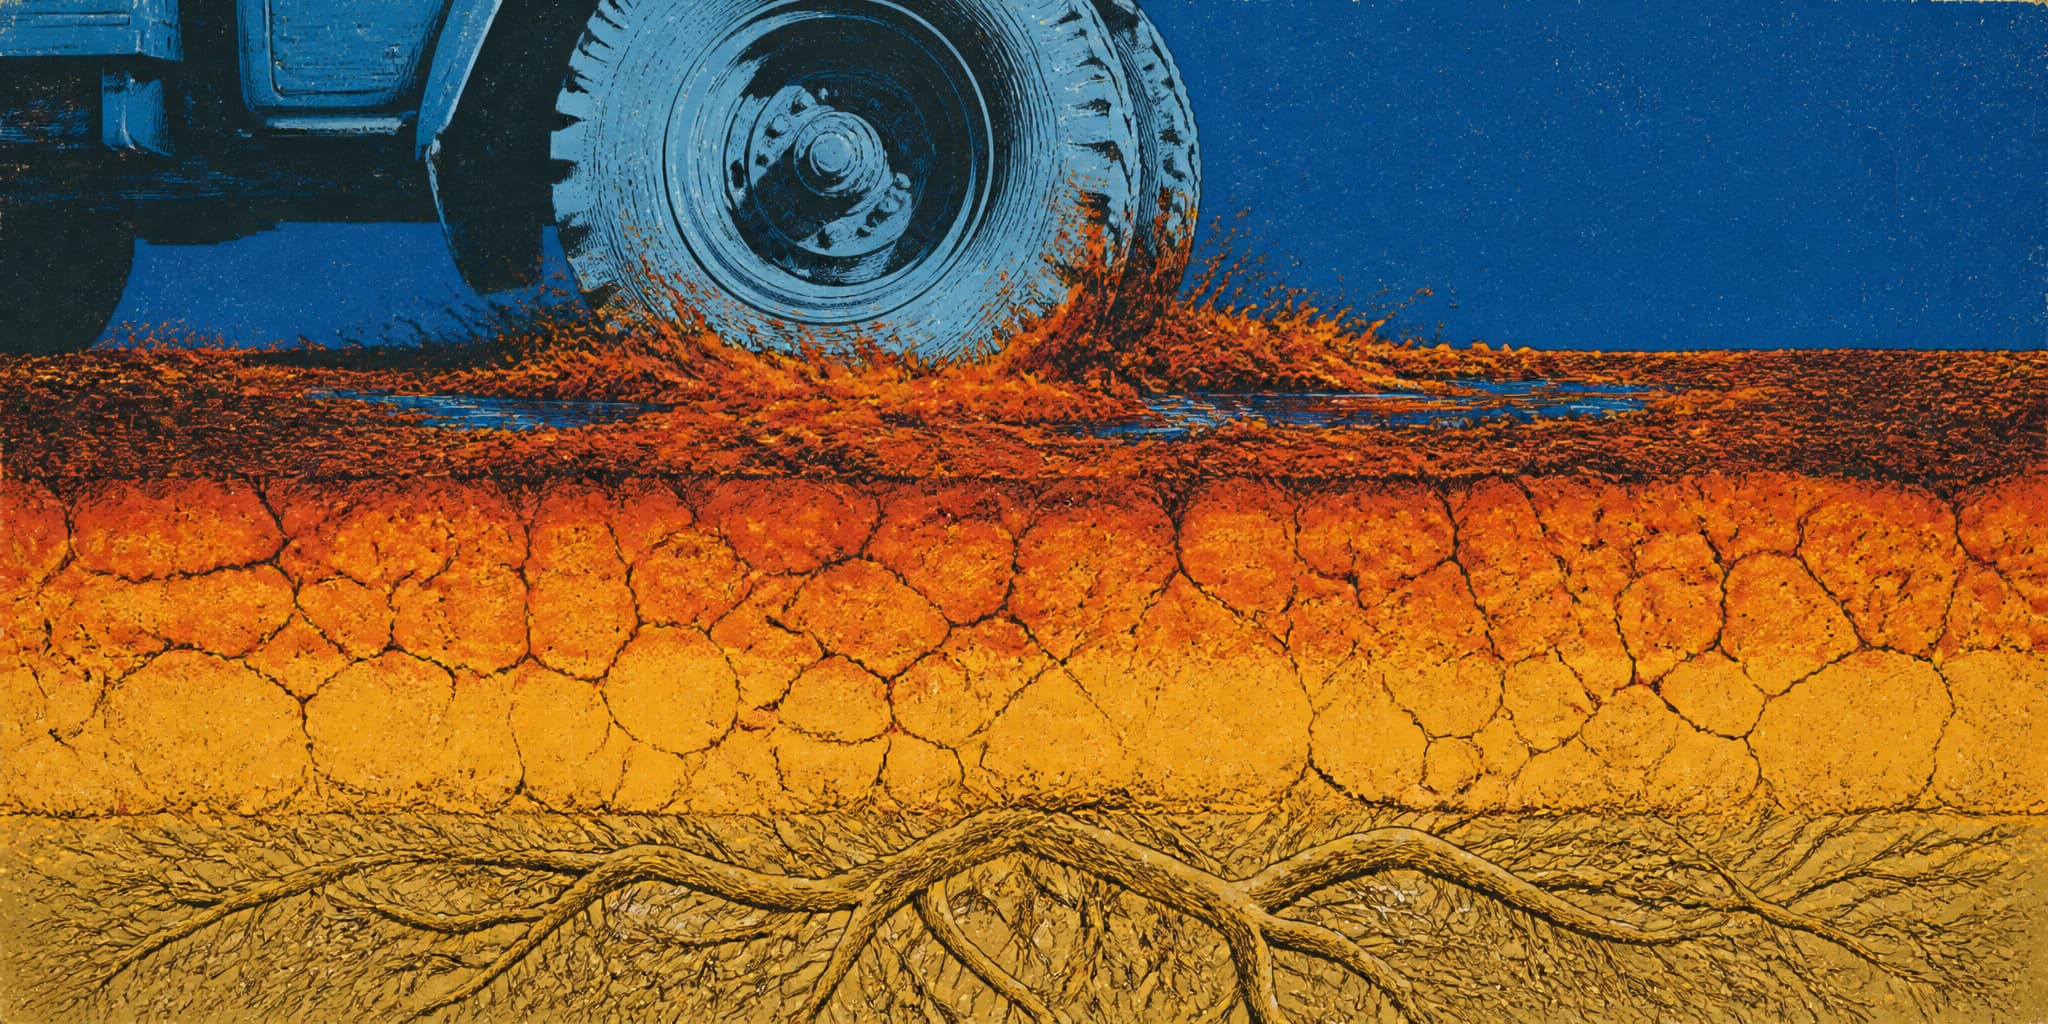
The week monsoon rain turned Mark Ragsdale's road to mud in southwest Colorado, he was still hauling water to his cattle three times a day, and his neighbors were calling to ask where they could find any. The top two inches had recovered. The meter below it hadn't. New research puts numbers to what ranchers and hydrologists have been living inside: drought has vertical structure, the layer our monitoring system measures best is the layer that comes back first, and the layer that decides whether crops, trees, and wells survive can stay depleted for years after the map says the rain fixed it.
The Drought Below the Surface
The week monsoon rain turned Mark Ragsdale's road to mud in southwest Colorado, he was still hauling water to his cattle three times a day, and his neighbors were calling to ask where they could find any. The top two inches had recovered. The meter below it hadn't. New research puts numbers to what ranchers and hydrologists have been living inside: drought has vertical structure, the layer our monitoring system measures best is the layer that comes back first, and the layer that decides whether crops, trees, and wells survive can stay depleted for years after the map says the rain fixed it.
Core Study Record
Multilayer soil moisture depletion intensifies drought impacts on global ecosystems
Profile-averaged drought metrics mask the worst episodes — the ones where no soil layer offers refuge — while inflating the apparent length of milder dry spells.
Southwestern North America is among six global hotspots where vertically compound drought is increasing at roughly 1.5 days per decade, attributed to human-caused warming with over 90% confidence.
Core Study Record
Anthropogenic enhancement of subsurface soil moisture droughts
A separate analytical approach reaching the same conclusion: subsurface drying trends are driven by climate change, not natural variability.
It develops slowly, recovers slowly, and sits below the depth most monitoring stations measure — making it functionally invisible until vegetation fails.
Greening Paradox
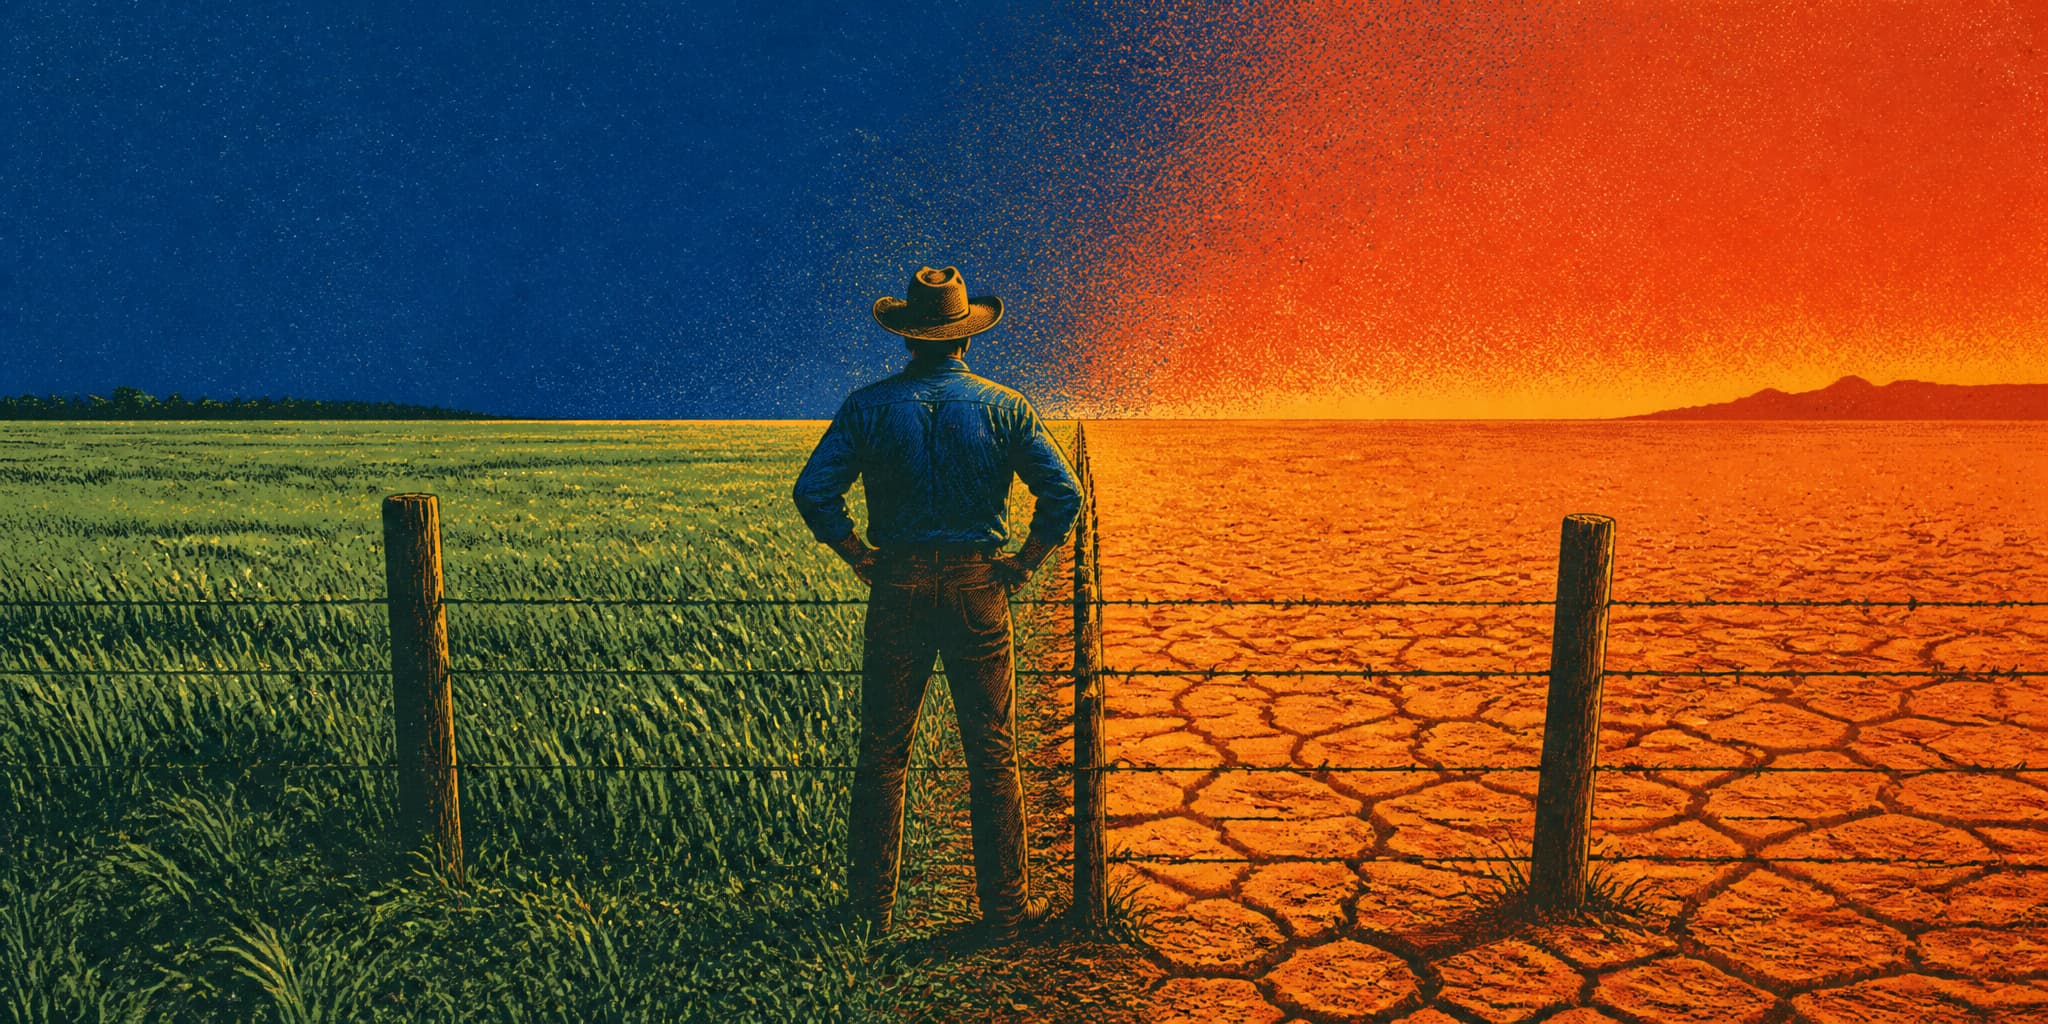
A study published this month in Nature Climate Change examined four decades of satellite vegetation data across global drylands and found something that should unsettle anyone reading averages as reassurance. From 1982 to 2020, average greenness increased — more leaf cover, higher productivity, confirmed across four independent satellite records. But across roughly 82% of those same drylands, year-to-year variability also widened. Good years got more productive. Bad years got worse. The trend line climbed while individual seasons became less predictable.
The study's attribution analysis points to a specific mechanism: rising CO2 lets dryland plants photosynthesize more efficiently, which amplifies their response to whatever rain arrives. So the same process producing the greening is producing the instability. The vegetation is more reactive to precipitation in both directions.
About 40% of US land qualifies as dryland, concentrated in the West. The thirteen vegetation models the study tested — the same class informing federal climate assessments — reproduce the greening trend and miss the variability. If you're stocking cattle in eastern Montana, planning rangeland restoration in New Mexico, or budgeting county drought response anywhere west of the hundredth meridian, the tools you're relying on see the average and miss the whiplash between seasons.